A reader asks:
Investing at all time highs is counterintuitive. Does it produce great returns because the market is forward-looking and investors are momentum investors? It doesn’t seem to make sense to buy just before a long severe bear market.
I understand the worry here.
All-time highs seem scary because every stock market crash in history started from one.
The thing you have to understand about markets is they are always and forever cyclical. Sometimes those cycles turn on a dime but most of the time markets overshoot to both the upside and the downside. The pendulum swings too far in both directions.
Why is this the case?
Humans are the ones controlling the markets, and our emotions can get the best of us when things are going wonderfully or terribly.
This is why volatility tends to cluster during downturns.
And new all-time highs tend to cluster during upturns.
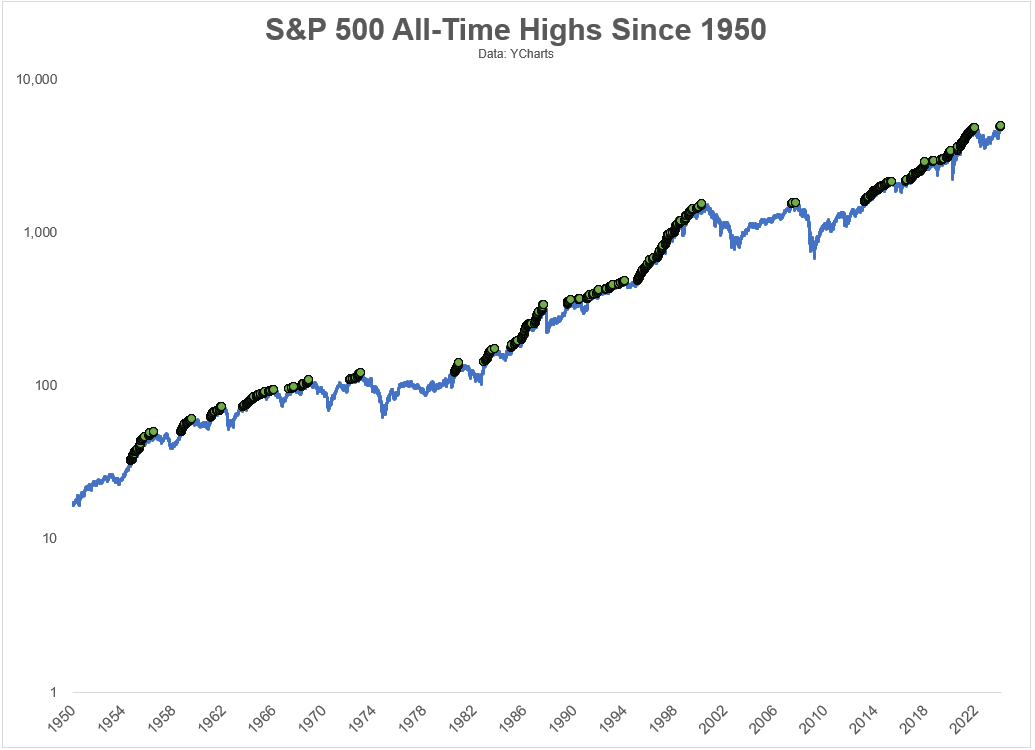
Take a look at this chart of the S&P 500 with new all-time highs plotted in green going back to 1950:

Look at all of those clusters of new highs!
Since 1950, there have been new all-time highs on 6.7% of all trading days.
But those percentages have been much higher during bull markets.
In the 1990s it was more than 12% of all trading days. After the 1929 highs were finally taken out in 1954, there was a new high in one of of every 10 trading days for the remainder of the decade. From 2013-2019, it happened on 14% of all trading days. Despite two bear markets this decade, the S&P 500 has hit new all-time highs on 11% of all trading days in the 2020s.
There have been instances when there were just a handful of new all-time highs and an immediate crash but it’s rare. In 2007, there were just nine new all-time highs before the peak that led to the Great Financial Crisis.
There are no guarantees with this stuff but new highs are nothing to be afraid of. In fact, new highs are a bullish signal most of the time.
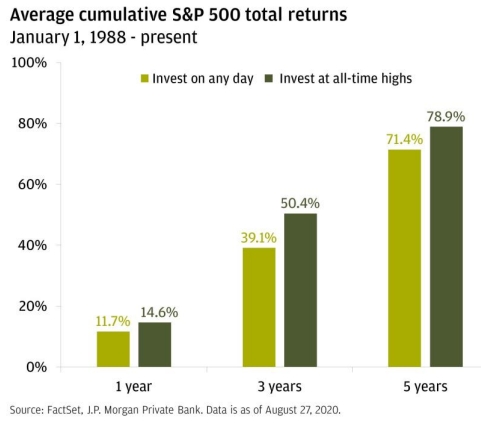
Check out this chart from JP Morgan:

They found that if you had invested in the S&P 500 on any given day since 1988, your average total return a year later would have been just shy of 12%.1
However, if you only invested on days where the S&P 500 closed at an all-time high your average total return would have been nearly 15%.2
The average returns were better from all-time highs!
These results are counterintuitive, but they make sense when you consider all of the behavioral biases we exhibit as a species.
Research shows that investors hold onto losing stocks too long in hopes they will come back to their original price while selling their winners too soon.
Investors also anchor to recent results, so initially markets underreact to news, events or data releases. Once things become more apparent, investors then move into more of a herd mentality. This overreaction can cause an overshoot to the upside or downside.
Fear, greed, overconfidence and confirmation bias can lead investors to pile into winning areas of the market after they’ve risen or pile out after they’ve fallen.
Add it all up and this is why cycles can persist longer than most investors assume possible. Nothing lasts forever in the markets but human nature is a good explanation for the clustering of both volatility to the downside and new all-time highs to the upside.
Then there is the simple explanation that the stock market goes up most of the time.
If you’re a long-term investor, you should expect to see plenty of new highs over the course of your investing lifecycle.
A handful of them will lead to a market crash.
Most of them will lead to more new highs.
We discussed this question on the latest Ask the Compound:
Blair duQuesnay joined me again this week to answer questions about financial planning when you have kids, dealing with skyrocketing home insurance, planning for an inheritance and how much you need for a house down payment.
Further Reading:
New All-Time Highs After a Bear Market
1And you would have made money 83% of the time on those 12-month time frames.
2Returns were positive 88% of the time.
