
A reader asks:
Long term S&P 500 return figures are often cited as going as far back as 1926. While nearly a century of numbers sounds great, nobody could really ‘buy’ the S&P back then. The index arrives in the 1950’s and Bogle’s index to actually buy it as a single purchase shows up in the mid-1970’s. Do 50-year long term return numbers since Bogle stay parallel to the projections back to 1926 or does this modern era exhibit any significant differences?
This is a person who knows their market history.
This is also my kind of question, so let’s dig into the history component before getting to the performance numbers.
The Standard Statistics Company1 originally began tracking 233 stocks, but it was too hard to maintain daily or hourly quotes on that many stocks before computers, so the S&P 90 was created in 1926.2
That original S&P 90 was made up of 50 industrials, 20 railroads and 20 utility stocks.
The S&P 500 was created in 1957 made up of 425 industrials, 60 utilities and 15 railroad stocks, which covered around 90% of U.S. stock market value.
In 1976, financial stocks were finally added to the index, which moved to a 400-40-40-20 model of industrials, utilities, financials and transport stocks.3
Jack Bogle’s inaugural Vanguard S&P 500 index fund was released that same year. In his final book, Bogle notes that the fund could only own 280 stocks because it would have been so onerous from a cost perspective to buy all 500 names. There was also an 8% sales load to buy that initial index fund.
By 1988, the fixed model of 400 industrials, 40 utilities, 40 financials, and 20 transports was abandoned to reflect a more dynamic economy.
Here’s the summary:
1923 – Standard Statistics Company begins publishing daily stock price averages for 233 companies.
1926 – Launch of the S&P 90: 50 industrials, 20 railroads, 20 utilities.
1957 – The S&P 500 is created: 425 industrials, 60 utilities, 15 railroads.
1976 – The index is revised to 400 industrials, 40 utilities, 40 financials, 20 transports.
1976 – Vanguard launches the first retail index fund tracking the S&P 500.
1988 – The fixed 400-40-40-20 model is abandoned; sector weights become adaptive to better reflect the economy.
Today you’re looking at something like 35% to 50% in technology stocks depending on how they’re categorized so we’ve obviously seen a lot of change over time.
Now, let’s look at the performance history.
I have good historical data from DFA that goes all the way back to 1926 and the launch of the S&P 90.
From 1926-1956 the S&P 500 compounded at an annual return of 10.1%. That’s not bad considering the Titanic-level disaster of the Great Depression which saw stocks fall more than 85%.
From the creation of the S&P 500 in 1957 through July of this year the S&P 500 has an annualized return of 10.6%.
The IPO for the first Vanguard S&P 500 index fund was on August 31, 1976. If you start from the beginning of September 1976, the S&P is up 11.8% per year.
Here’s a handy chart I created:
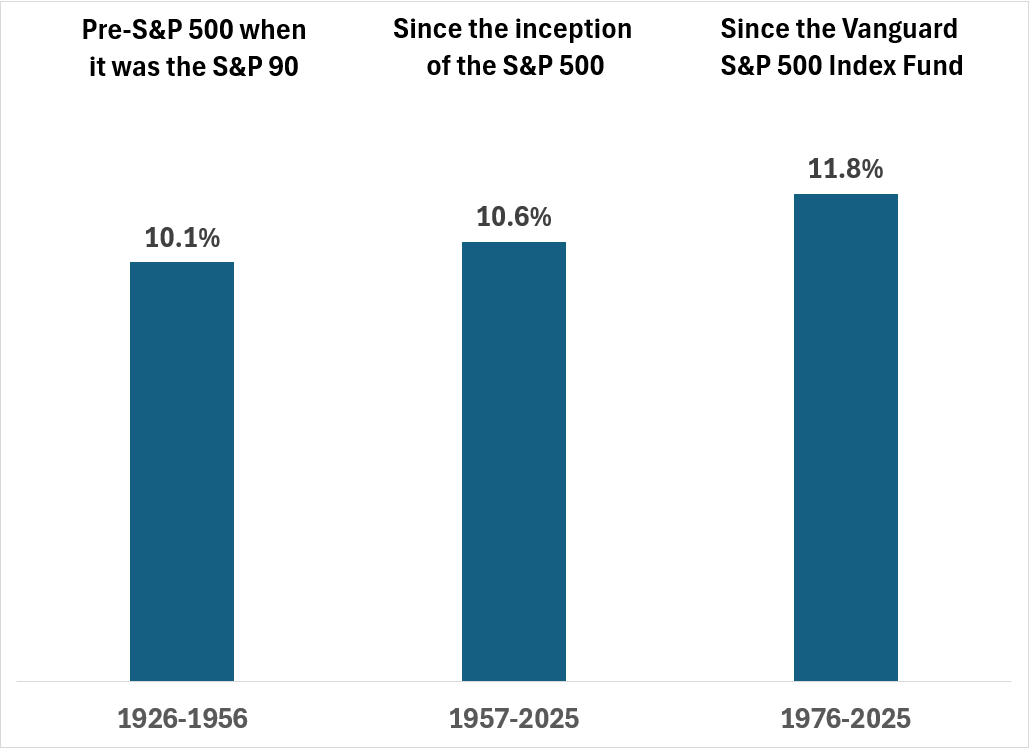
As you can see, the returns haven’t degraded over time with the advent of the S&P 500 index or the index fund. In fact, they’ve gotten better which is partly from the fact that it’s now easier to invest in the stock market.
More people investing means more money flowing into stocks which means higher valuations and such.
Certainly, you could poke some holes by changing your start and end dates to make things look better or worse than these figures. But I’d say these time frames cover a wide range of market and economic environments.
Here’s another way to view longer-term S&P 500 returns:
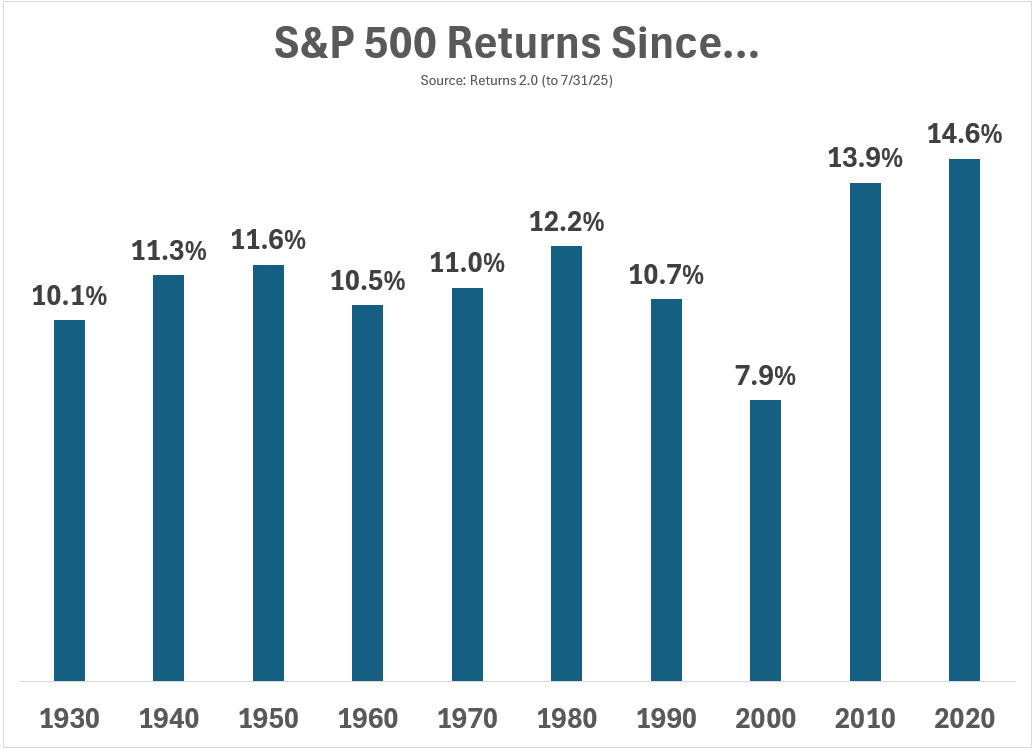
Over shorter time frames you can get higher (2010 and 2020) or lower (2000) than average results. Over longer time frames the annual returns are relatively consistent.
There’s plenty more that can and will be thrown at the stock market in the coming decades but the changes we’ve experienced over the past 50-75 years in market structure haven’t damaged portfolio returns.
The long run still wins out.
I answered this question on the latest edition of Ask the Compound:
Barry Ritholtz joined me on the show this week to discuss questions about buying luxury vehicles on the cheap, how to diversify away from the Mag 7, how to measure your financial advisor’s performance, and how to perform due diligence on private investment opportunities.
Further Reading:
The Evolution of Financial Advice
1They didn’t merge with Poors Publishing until the early 1940s, which is when it became Standard & Poors.
2You could see the prices for the S&P 90 on an hourly basis while the rest of the stocks they tracked only had weekly price reporting.
3It’s crazy that it took this long but apparently many financial companies traded over the counter in the past.