
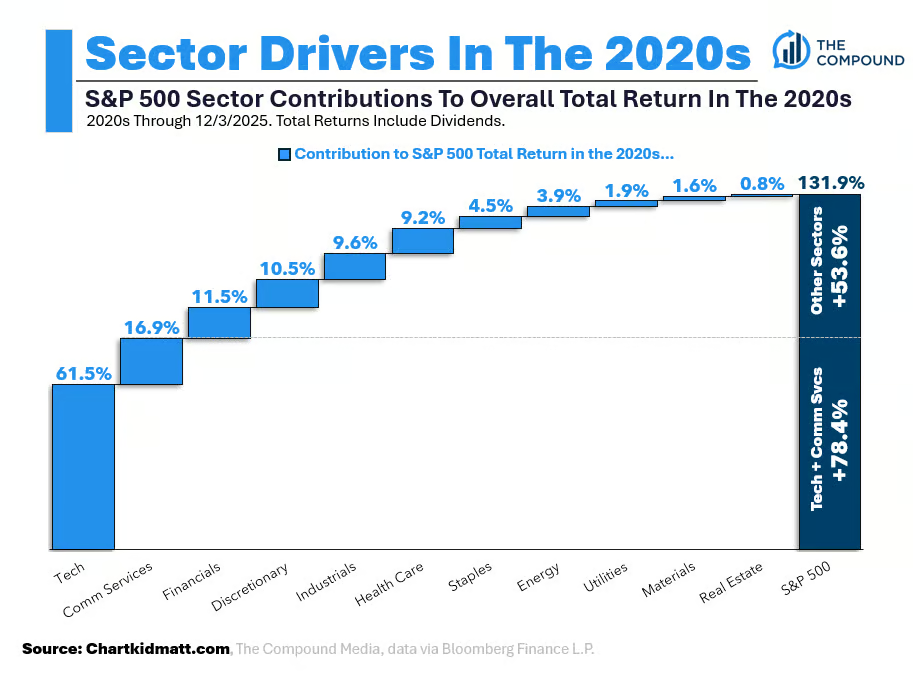
Chart Kid Matt has this great chart on his blog about sector returns for the S&P 500 this decade:
Here’s Matt on the numbers:
I knew Tech has carried this decade, but I was still shocked when I ran the numbers.
61.5% of the S&P 500’s 131.9% return has come from Tech.
No other sector even comes close.
Loop in Comm Services and that’s 78.4% of the 131.9% overall gain in the S&P 500 coming from just two sectors.
Power laws in the stock market strike again.
Tech stock returns seem to defy logic but these types of stocks have a history of gigantic moves — both up and down.
The size of the gains and losses are staggering when you dig into the data.
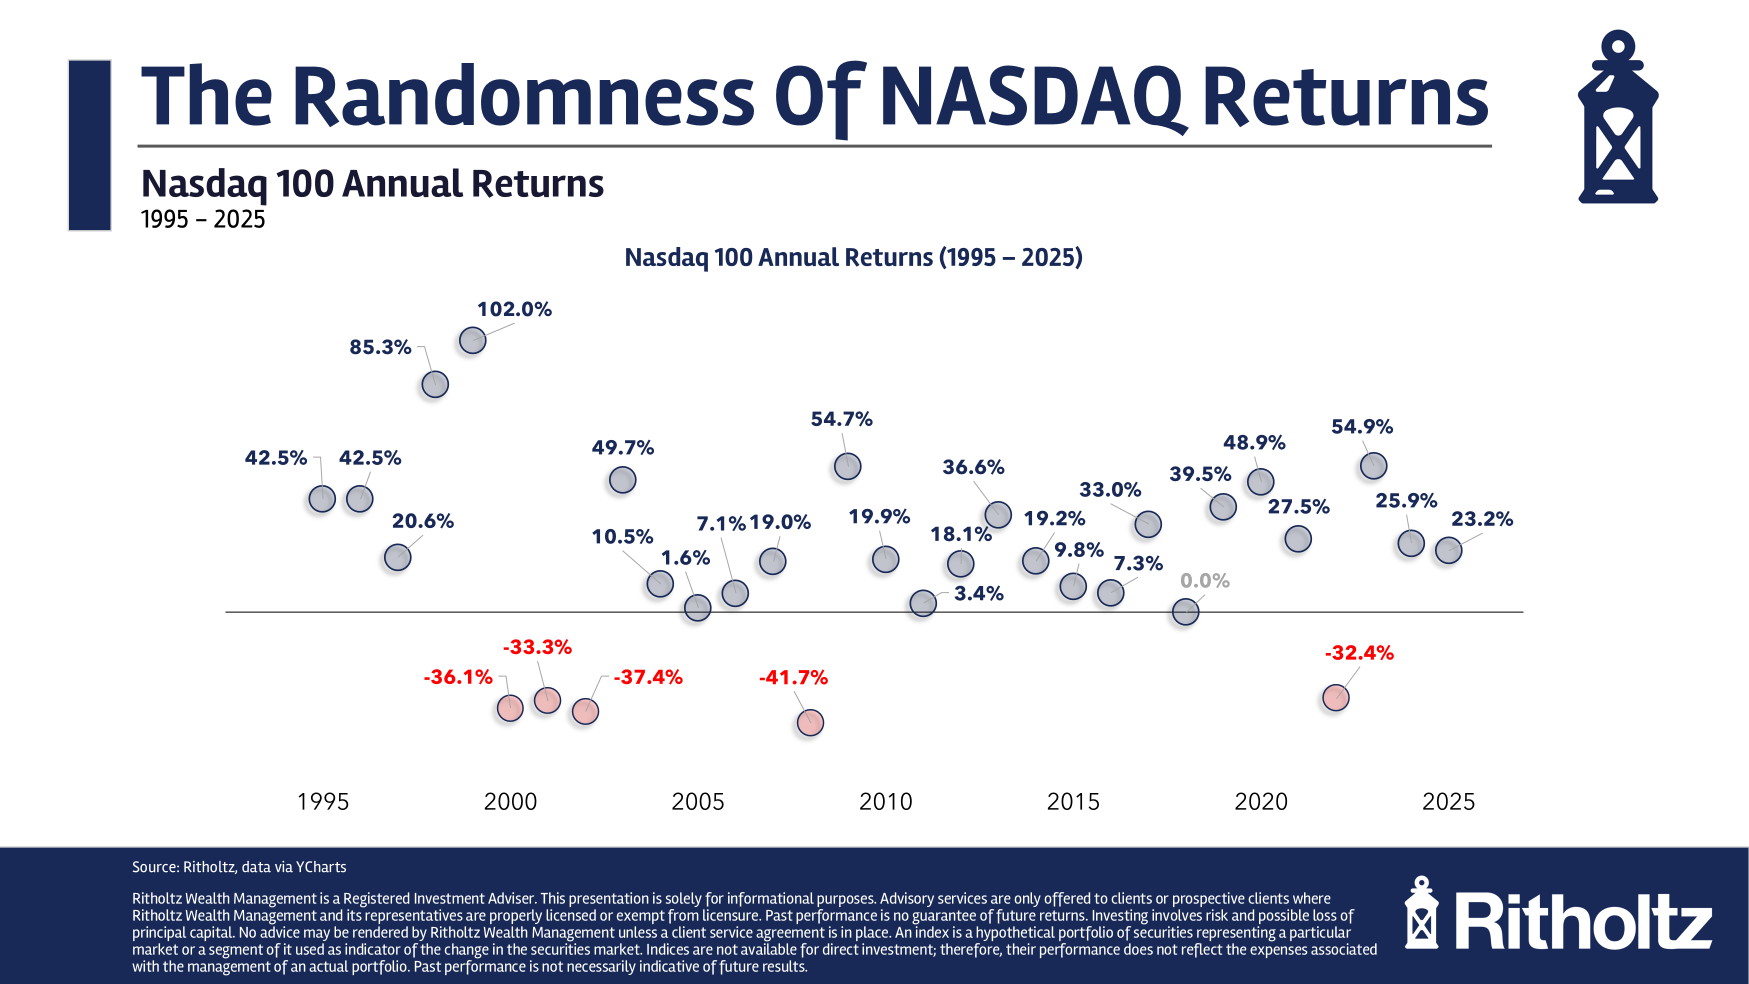
Here are the calendar year returns for the Nasdaq 100 since 1995:
A few things stand out from this chart.
First, there have been far more gains than losses. In the past 31 years, gains outnumber losses by a ratio of 26 to 5. That means the Nasdaq 100 has been up in 84% of those years.
The gains tend to be large to quite large.
In 1 out of every 4 years, gains have been 40% or more. Nearly half of the years since 1995 have seen gains of 20% or higher.
Losses are few and far between but when they happen they’re no joke.
You’ll notice there are just five red numbers for the down years on the chart. Every single one of those losses was -30% or worse.
These were the five down years since 1995:
- 2000: -36.1%
- 2001: -33.3%
- 2002: -37.4%
- 2008: -41.7%
- 2022: -32.4%
Remarkably, every down year for the past 3 decades has been a gargantuan loss. In contrast, the S&P 500 has had just one down year with losses of 30% or more (in 2008 when it fell 37%).
It’s also crazy that after the dot-com bubble ended there were three years in a row of losses in excess of 30%.
The max drawdown for the S&P 500 was -57% while the Nasdaq 100 dropped more than 80% following the bursting of the dot-com bubble and the Great Financial Crisis.
There have been far bigger booms and busts in the Nasdaq 100 but investors have been rewarded for those risks.
These are the annual returns since 1995:
- Nasdaq 100 +15.0%
- S&P 500 +11.1%
No pain, no gain.
The big question is this: Will the next down year, whenever it happens, be this bad?
We shall see…
Further Reading:
How Much Will the Stock Market Fall in 2026?
1The Nasdaq 100 isn’t all tech stocks but they make up aroudn 70% of the index right now if you include communication services.
This content, which contains security-related opinions and/or information, is provided for informational purposes only and should not be relied upon in any manner as professional advice, or an endorsement of any practices, products or services. There can be no guarantees or assurances that the views expressed here will be applicable for any particular facts or circumstances, and should not be relied upon in any manner. You should consult your own advisers as to legal, business, tax, and other related matters concerning any investment.
The commentary in this “post” (including any related blog, podcasts, videos, and social media) reflects the personal opinions, viewpoints, and analyses of the Ritholtz Wealth Management employees providing such comments, and should not be regarded the views of Ritholtz Wealth Management LLC. or its respective affiliates or as a description of advisory services provided by Ritholtz Wealth Management or performance returns of any Ritholtz Wealth Management Investments client.
References to any securities or digital assets, or performance data, are for illustrative purposes only and do not constitute an investment recommendation or offer to provide investment advisory services. Charts and graphs provided within are for informational purposes solely and should not be relied upon when making any investment decision. Past performance is not indicative of future results. The content speaks only as of the date indicated. Any projections, estimates, forecasts, targets, prospects, and/or opinions expressed in these materials are subject to change without notice and may differ or be contrary to opinions expressed by others.
The Compound Media, Inc., an affiliate of Ritholtz Wealth Management, receives payment from various entities for advertisements in affiliated podcasts, blogs and emails. Inclusion of such advertisements does not constitute or imply endorsement, sponsorship or recommendation thereof, or any affiliation therewith, by the Content Creator or by Ritholtz Wealth Management or any of its employees. Investments in securities involve the risk of loss. For additional advertisement disclaimers see here: https://www.ritholtzwealth.com/advertising-disclaimers
Please see disclosures here.