
There are some concepts you hear about in life that make sense the moment you learn about them.
Occam’s Razor. The 80/20 rule. Murphy’s Law. Index funds.
Indexing made sense to me right off the bat. Low costs. Tax efficient. Low turnover. Low maintenance. Simple. And very hard to beat over the long-run (even by professional money managers).
I’ve been investing in index funds for more than 20 years. If anything the case for indexing has only gotten stronger over that time.
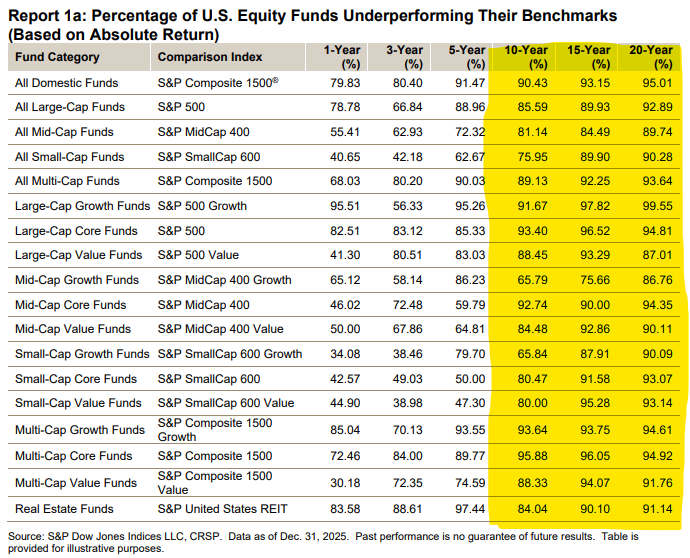
My baseline expectation was always that index funds would outperform something like 70-75% of actively managed funds.
The SPIVA Scorecard shows over 10, 15 and 20 year time horizons in recent decades that it’s been more like 90% or more for a wide variety of stock market styles:
One of the reasons I like index funds is because stock-picking is hard. Indexing allows you to cast a wide enough net to ensure you’ll hold the big winners, which more than make up for the big losers.
I didn’t fully comprehend just how concentrated the returns were in those winners until I read Hendrik Bessembinder’s work. In 2018, Bessembinder published Do Stocks Outperform T-Bills?
His research found that over the very long-term:
- Nearly 60% of all stocks underperform T-bills.
- Most other stocks barely outperform cash.
- Around 4% of stocks account for the vast majority of overall gains.
This research was like confirmation bias on steroids for indexers. I knew the stock market was concentrated but didn’t realize it was this concentrated. This is a big deal for index funds because you automatically own the biggest winners. And those wins tend to be enormous.
Bessembinder released an update to his findings last week in a new paper titled One Hundred Years in the U.S. Stock Market. Over the past decade the stock market’s long-term gains have become ever more concentrated:
Over the 1926 to 2016 period studied in Bessembinder (2018), 89 firms accounted for half of the $43 trillion in net wealth creation. After including outcomes for the most recent nine years, just 46 firms account for half of the $91 trillion in net wealth creation over the full century.
My new research assistant Claude combed through the data in his research to show it more visually.
Here’s a better look at how markets are skewed to the big winners:
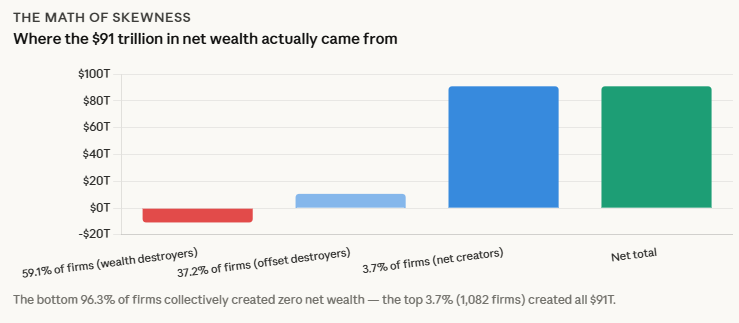
It’s almost hard to fathom how much money was created by such a small subset of companies.
Here’s another wat to look at this by the percentage of wealth created using the original study and the updated numbers:
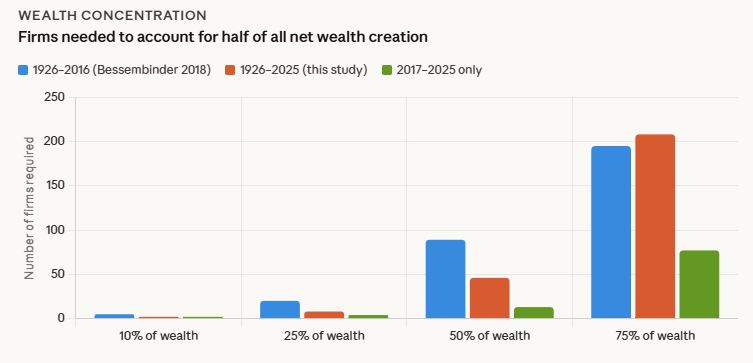
From 1926-2025 just 208 companies created 75% of the wealth in the stock market.
Here’s a breakdown of how many stocks beat T-bills by 10-year increments:
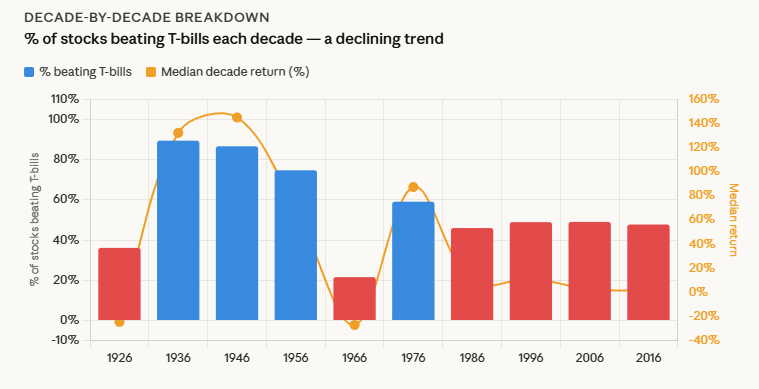
The win rate over the past 40 years is surprisingly steady at around 50%, meaning half of the companies beat cash while the other half failed to keep up with the risk-free rate.
Of course, this study is the very long-term. Individual stocks can still experience gains before they eventually trail off. Not every investor is of the buy-and-hold variety. There are other opportunities in-between.
And index funds are nothing special. There are other ways you can create tax-efficient, long-term investment strategies within a simple, rules-based framework.
I’m not saying indexing is the only way to invest.
But the data shows why index funds are so tough to beat over the long haul.
Michael and I talked about Bessembinder’s research, the best stocks in history and much more on this week’s Animal Spirits video:
Subscribe to The Compound so you never miss an episode.
Further Reading:
Debunking the Silly “Passive is a Bubble” Myth
Now here’s what I’ve been reading lately:
Books:
This content, which contains security-related opinions and/or information, is provided for informational purposes only and should not be relied upon in any manner as professional advice, or an endorsement of any practices, products or services. There can be no guarantees or assurances that the views expressed here will be applicable for any particular facts or circumstances, and should not be relied upon in any manner. You should consult your own advisers as to legal, business, tax, and other related matters concerning any investment.
The commentary in this “post” (including any related blog, podcasts, videos, and social media) reflects the personal opinions, viewpoints, and analyses of the Ritholtz Wealth Management employees providing such comments, and should not be regarded the views of Ritholtz Wealth Management LLC. or its respective affiliates or as a description of advisory services provided by Ritholtz Wealth Management or performance returns of any Ritholtz Wealth Management Investments client.
References to any securities or digital assets, or performance data, are for illustrative purposes only and do not constitute an investment recommendation or offer to provide investment advisory services. Charts and graphs provided within are for informational purposes solely and should not be relied upon when making any investment decision. Past performance is not indicative of future results. The content speaks only as of the date indicated. Any projections, estimates, forecasts, targets, prospects, and/or opinions expressed in these materials are subject to change without notice and may differ or be contrary to opinions expressed by others.
The Compound Media, Inc., an affiliate of Ritholtz Wealth Management, receives payment from various entities for advertisements in affiliated podcasts, blogs and emails. Inclusion of such advertisements does not constitute or imply endorsement, sponsorship or recommendation thereof, or any affiliation therewith, by the Content Creator or by Ritholtz Wealth Management or any of its employees. Investments in securities involve the risk of loss. For additional advertisement disclaimers see here: https://www.ritholtzwealth.com/advertising-disclaimers
Please see disclosures here.