Diversification is one of the first building block portfolio management concepts I ever learned in my first job in the investment industry.
Our firm would create a Harry Markowitz efficient frontier chart for every client portfolio. The idea was to show that risk comes not from individual holdings but how those holdings work together to reduce overall portfolio risk.
The interesting thing to me about producing these charts is how they would change over time. Correlations, co-variances and asset class relationships are not static. They are dynamic and constantly changing depending on the environment.
Diversification benefits change over time as well.
Some investors assume negatively correlated assets should be the goal. After all, wouldn’t it be wonderful to find an asset that always goes up when the stock market goes down?
This makes sense when stocks go down but stocks go up most of the time. Finding an asset that is negatively correlated with the stock market all the time is not an ideal investment strategy because it’s a money loser.
What you want is an asset that has a low positive or negative correlation to stocks with the understanding that correlation will change over time. At least that’s a more realistic goal.
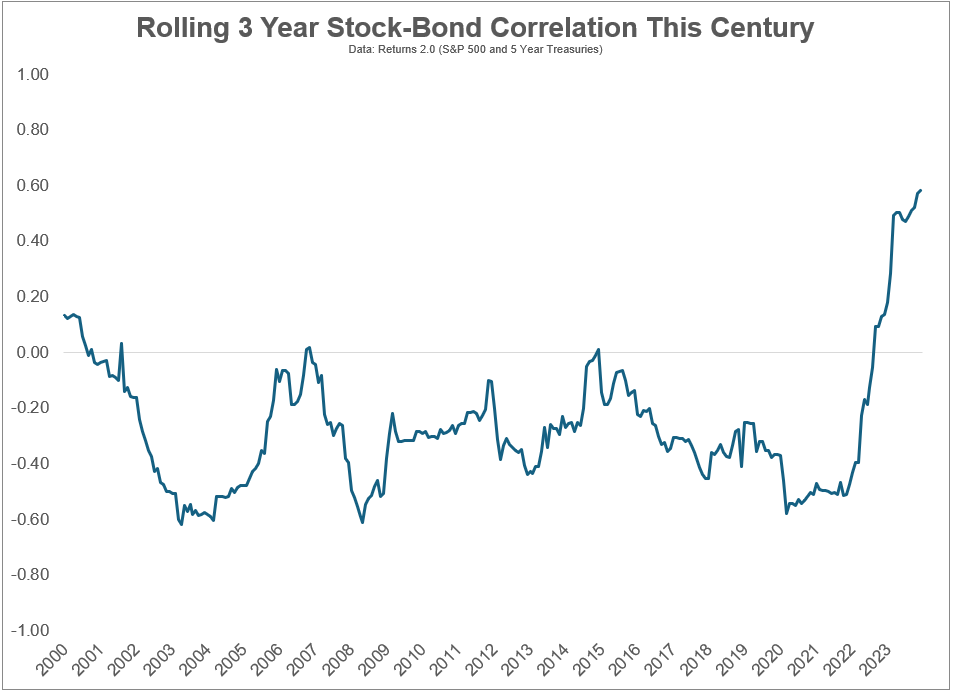
Take a look at the rolling 36-month correlation between U.S. stocks and bonds this century:

It’s been in negative territory for the majority of this century until it broke into positive territory in recent years. This tells us stock and bond returns are now moving more in lock-step with one another. That’s not a bad thing when stocks are going up but stocks got slammed in 2022 while bonds had one of their worst years on record.
Many investors worry about stocks and bonds having higher correlation because it reduces the diversification benefits.
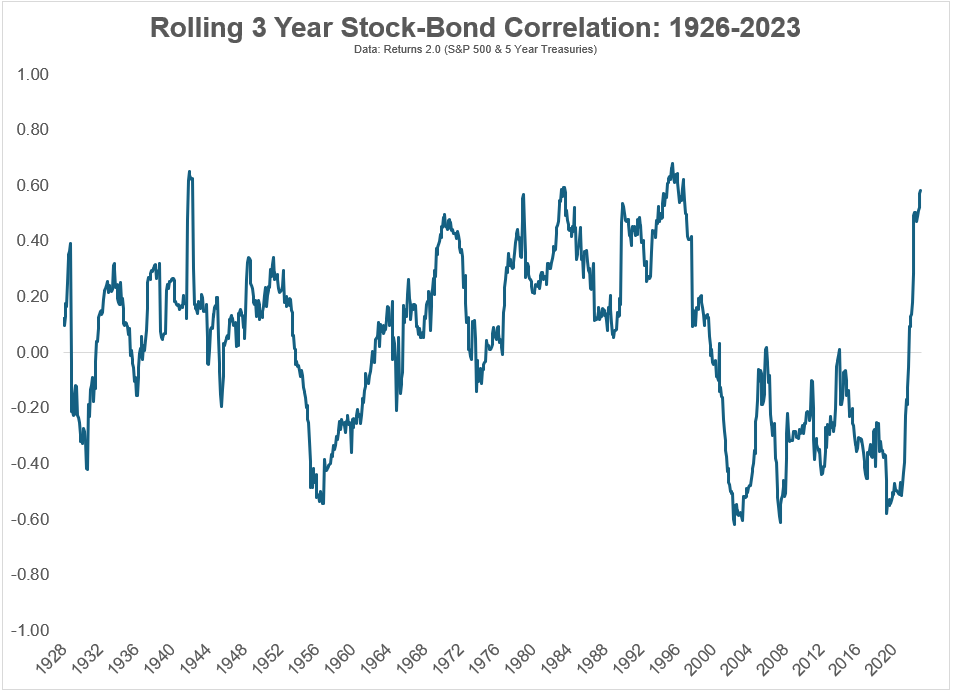
I understand this worry but it’s important to note these correlations flip from positive to negative more than you think. Let’s zoom out a little further:

Stocks and bonds have been positively correlated 61% of the time and negatively correlated 39% of the time. So it’s perfectly normal for these two assets to move in the same direction concurrently.1
It’s also important to distinguish between short-term and long-term correlations.
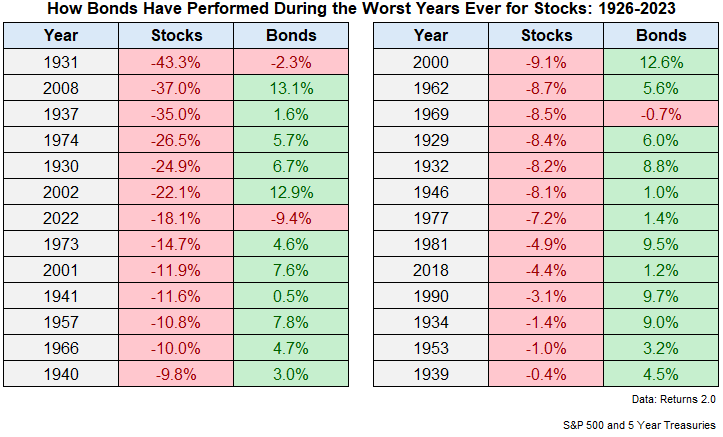
Yes, stocks and bonds both fell in 2022 but that’s a historical outlier. Take a look at the returns for bonds during every down year for the U.S. stock market since 1926:

The average loss for a down year in the stock market is -13.4%. In those same years the average return for 5 year Treasuries was +4.9%. That’s a pretty good spread.
Five year treasuries were down in the same year as stocks just three times out of 26 instances in this time frame (including 2022). Nothing works all the time when it comes to investing but that’s a good batting average.
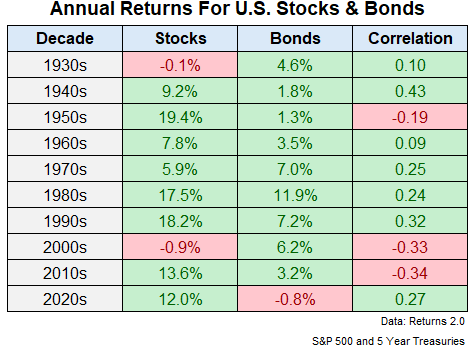
Correlations look different by decade as well:

There are times when a positive correlation helped (like the 1980s and 1990s). There are times when a negative correlation helped (like the 2000s and 2010s).
And even though stocks and bonds have been more positively correlated of late, and bonds are having a rough go at it in the 2020s, stocks are still up quite a bit to start this decade.
There is no Holy Grail of asset allocation that allows you to keep up when stocks are rising and perfectly hedges your portfolio when stocks are falling.
The best you can hope for is a portfolio that’s durable enough for your psyche to handle a variety of economic and market environments.
My biggest takeaway from studying Markowitz and portfolio theory is you want to diversify into asset classes and strategies that will go into and out of favor with the broader stock market.
I think bonds still fit that bill despite the 2020s bear market.
Further Reading:
Historical Returns For Stocks, Bonds & Cash
1Although it is worth pointing out the current correlation of +0.59 is in the top 3% of positive correlation readings since 1926.
