
A reader asks:
The historical inflation rate over the past 75 years or so is 3%. The Fed’s target is 2% inflation. What do you think the right goal is and which level do you think is more likely going forward?
Here is the inflation rate since 1950:
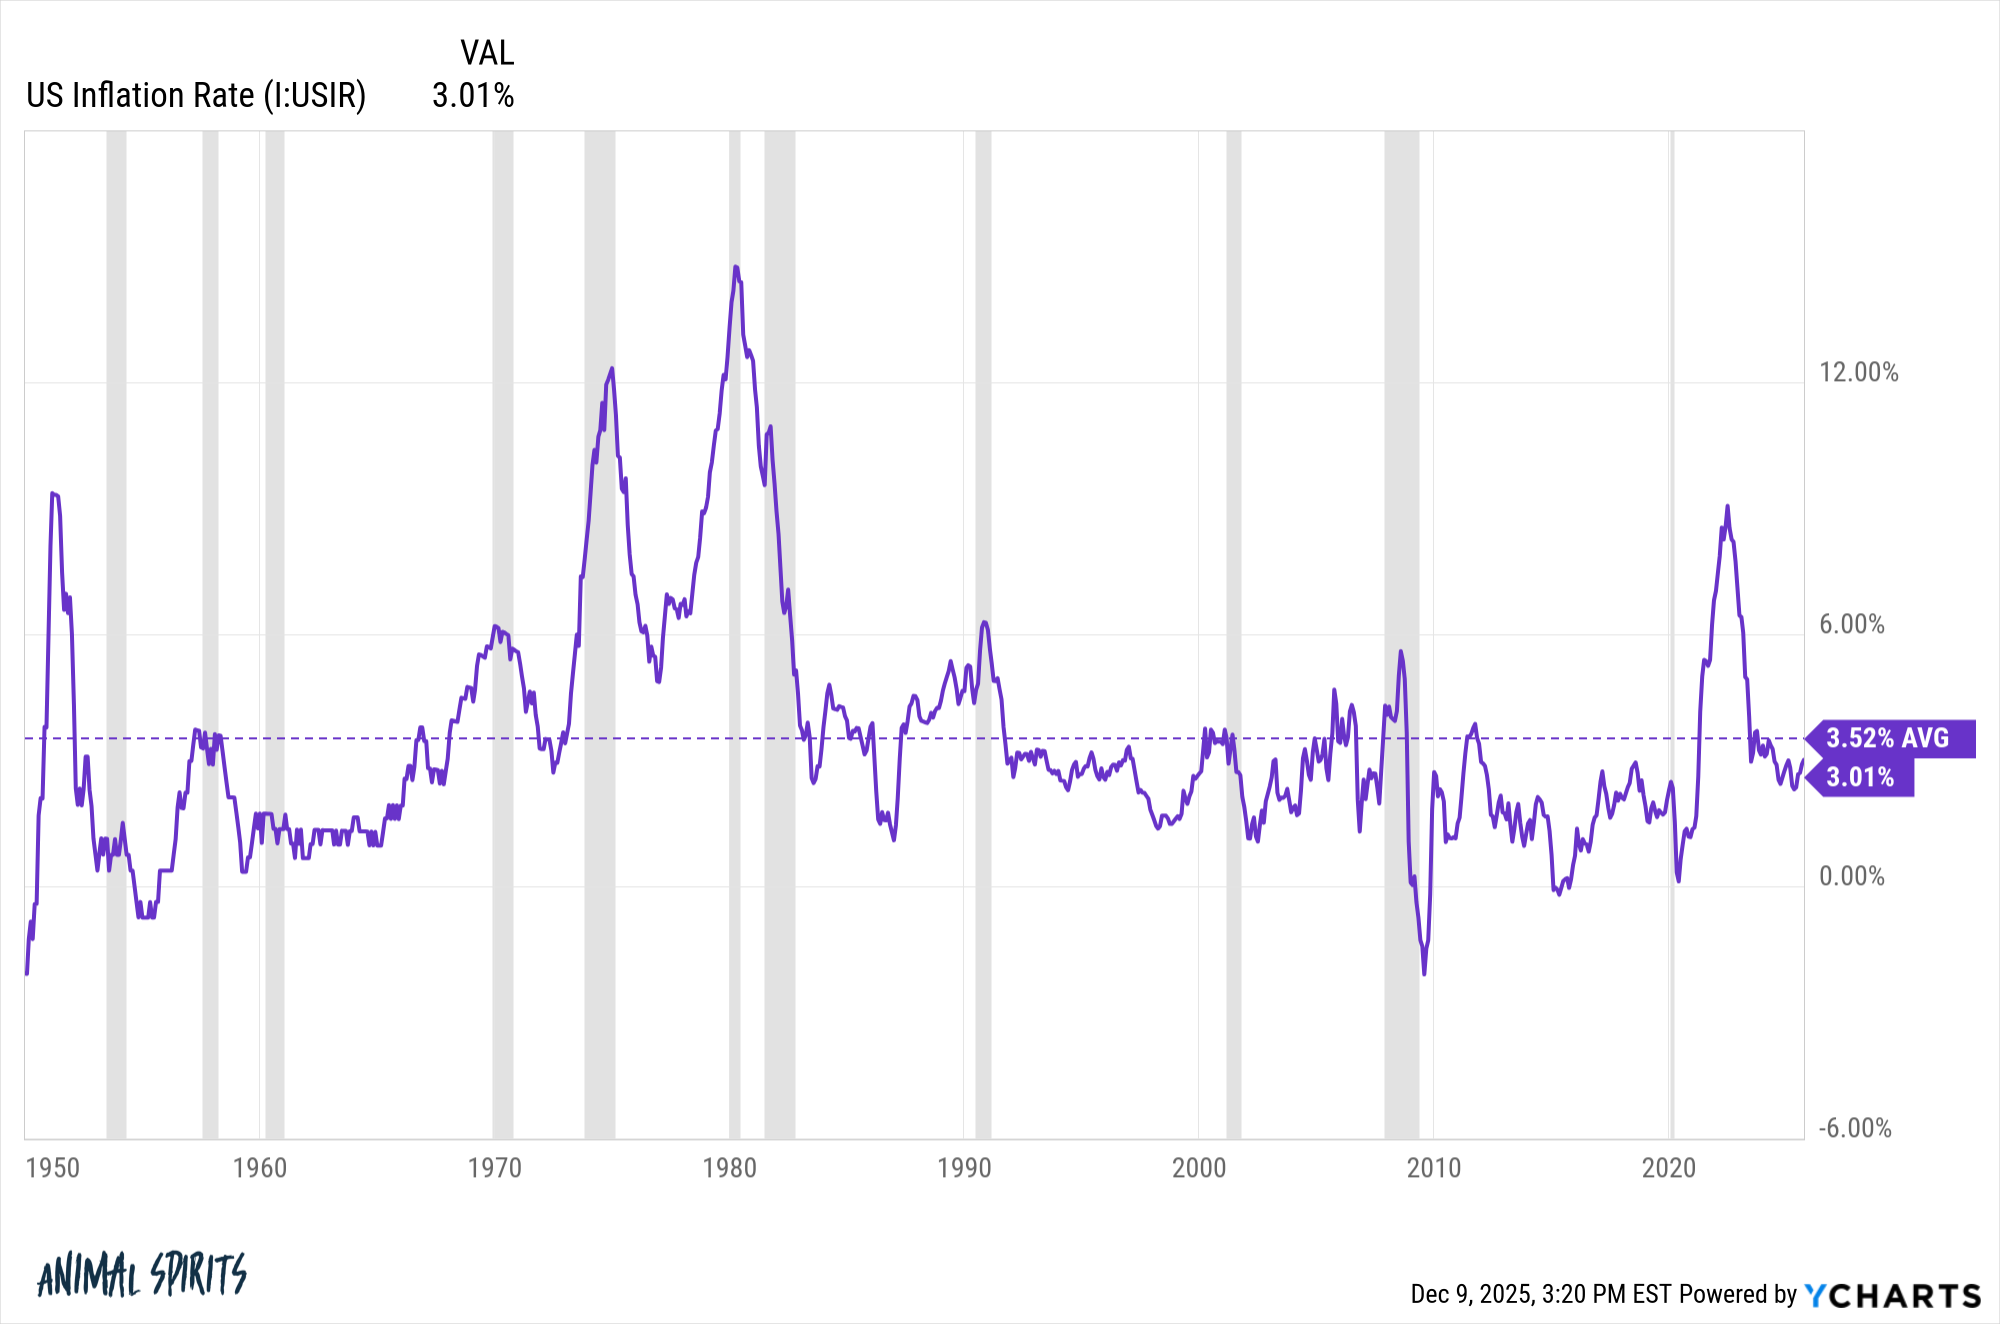
The average inflation rate has been 3.5% but you can see from the chart there has been a wide range around that long-term average.
Look at the inflation rate by decade:
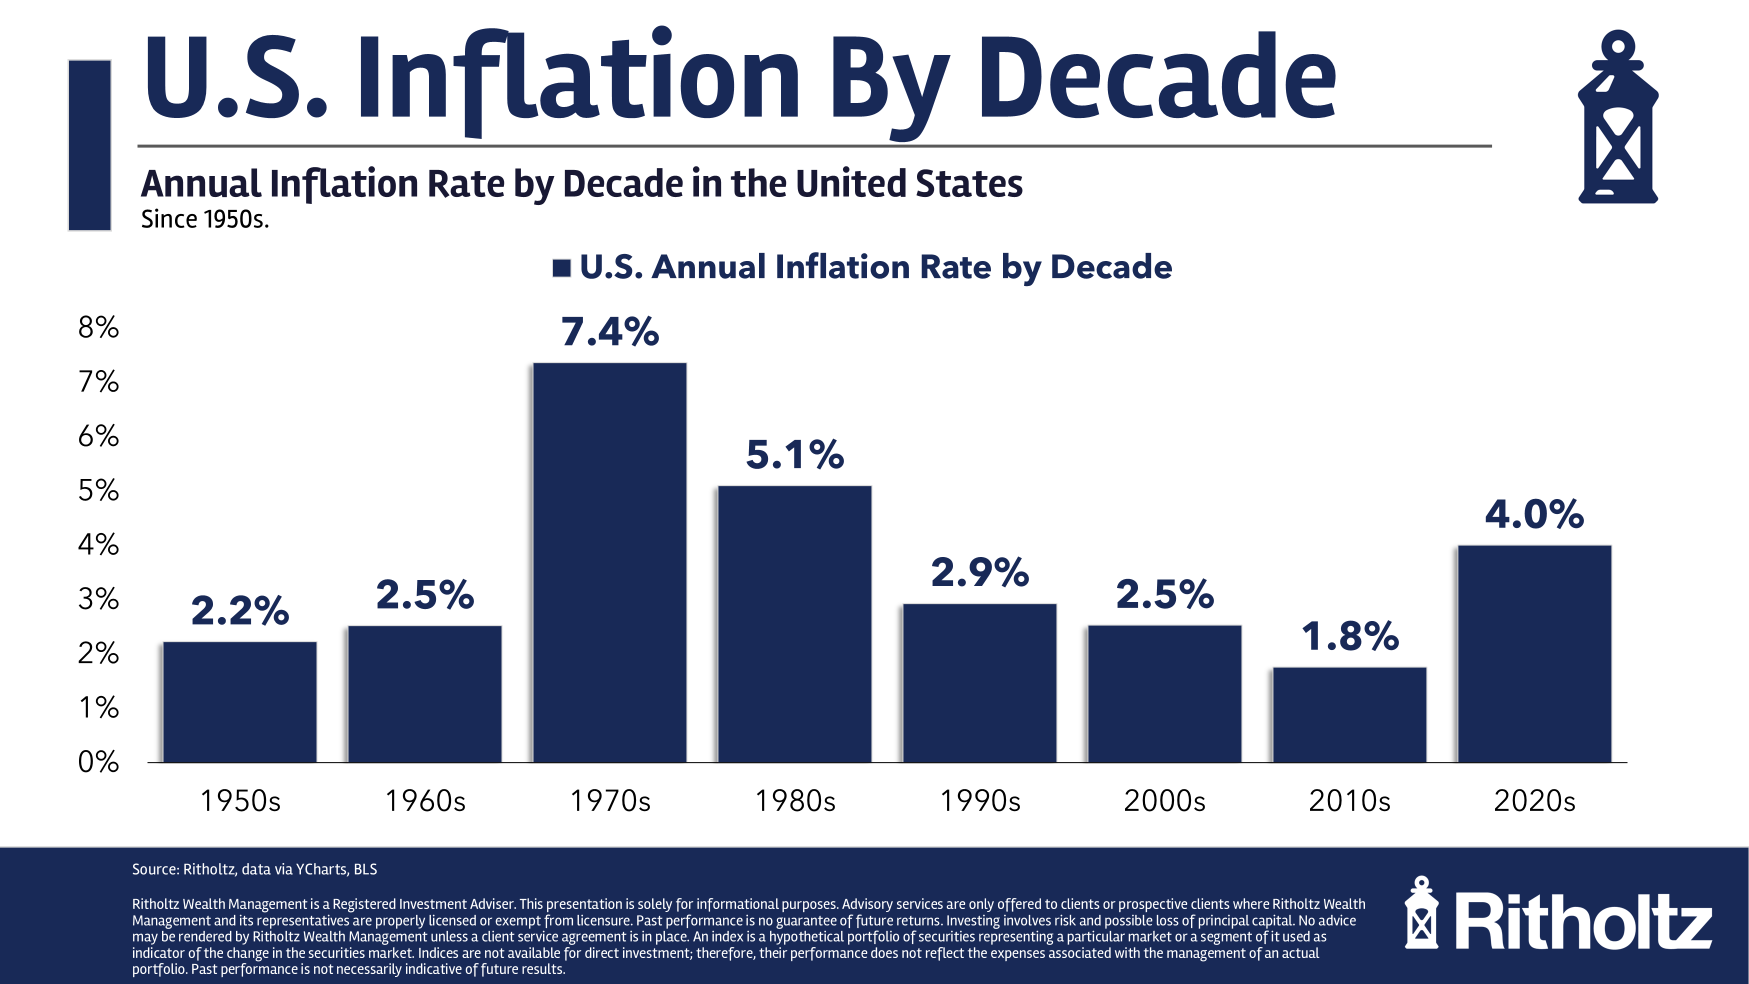
Inflation was well below average in the 2010s which is one of the reasons higher than average inflation has felt so painful in the 2020s.
Obviously, the low inflation in the 2010s came about because of the overhang from the Great Financial Crisis.
Ironically, the fact that we didn’t get a recession following 9% inflation in 2022 is one of the reasons inflation has remained higher this decade. In fact, this was the first time inflation exceeded 5% without leading to a recession.
We can’t live out counterfactuals so the fact that we didn’t go into a recession doesn’t give people a sense of relief as much as the inflation this decade annoys people.
And people are really annoyed by higher prices.
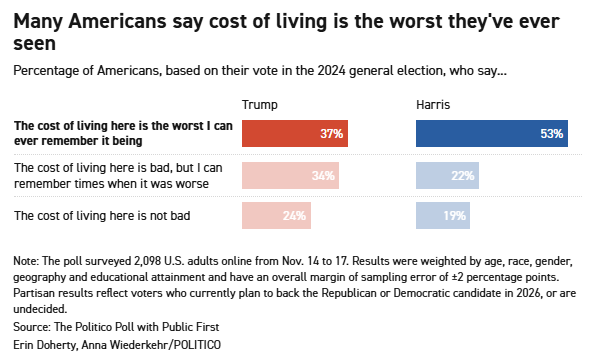
Politico has a survey that shows almost half of Americans polled say the cost of living is worse than ever:
Gallup has been asking Americans for decades what their biggest financial concern is:

Unsurprisingly, inflation has been at the top of the list since it took off in 2022.
People really hate inflation.
Interestingly enough, inflation was only above average for about two years. It first went above 4% in April 2021 and has been below 4% since May 2023. Things have settled down since then and are back to “normal.”
But we all know it’s not the rate of change that matters; it’s the cumulative change.
The consumer price index is up around 26% in the 2020s in total. That’s why $16 meals at Applebee’s are now $20. It’s why the cost of an average new vehicle is $50k.
On average, wages have kept up with inflation but the sticker shock doesn’t go away when you experience price changes like this.
I’m no good at predicting inflation but neither is anyone else. How could they be?
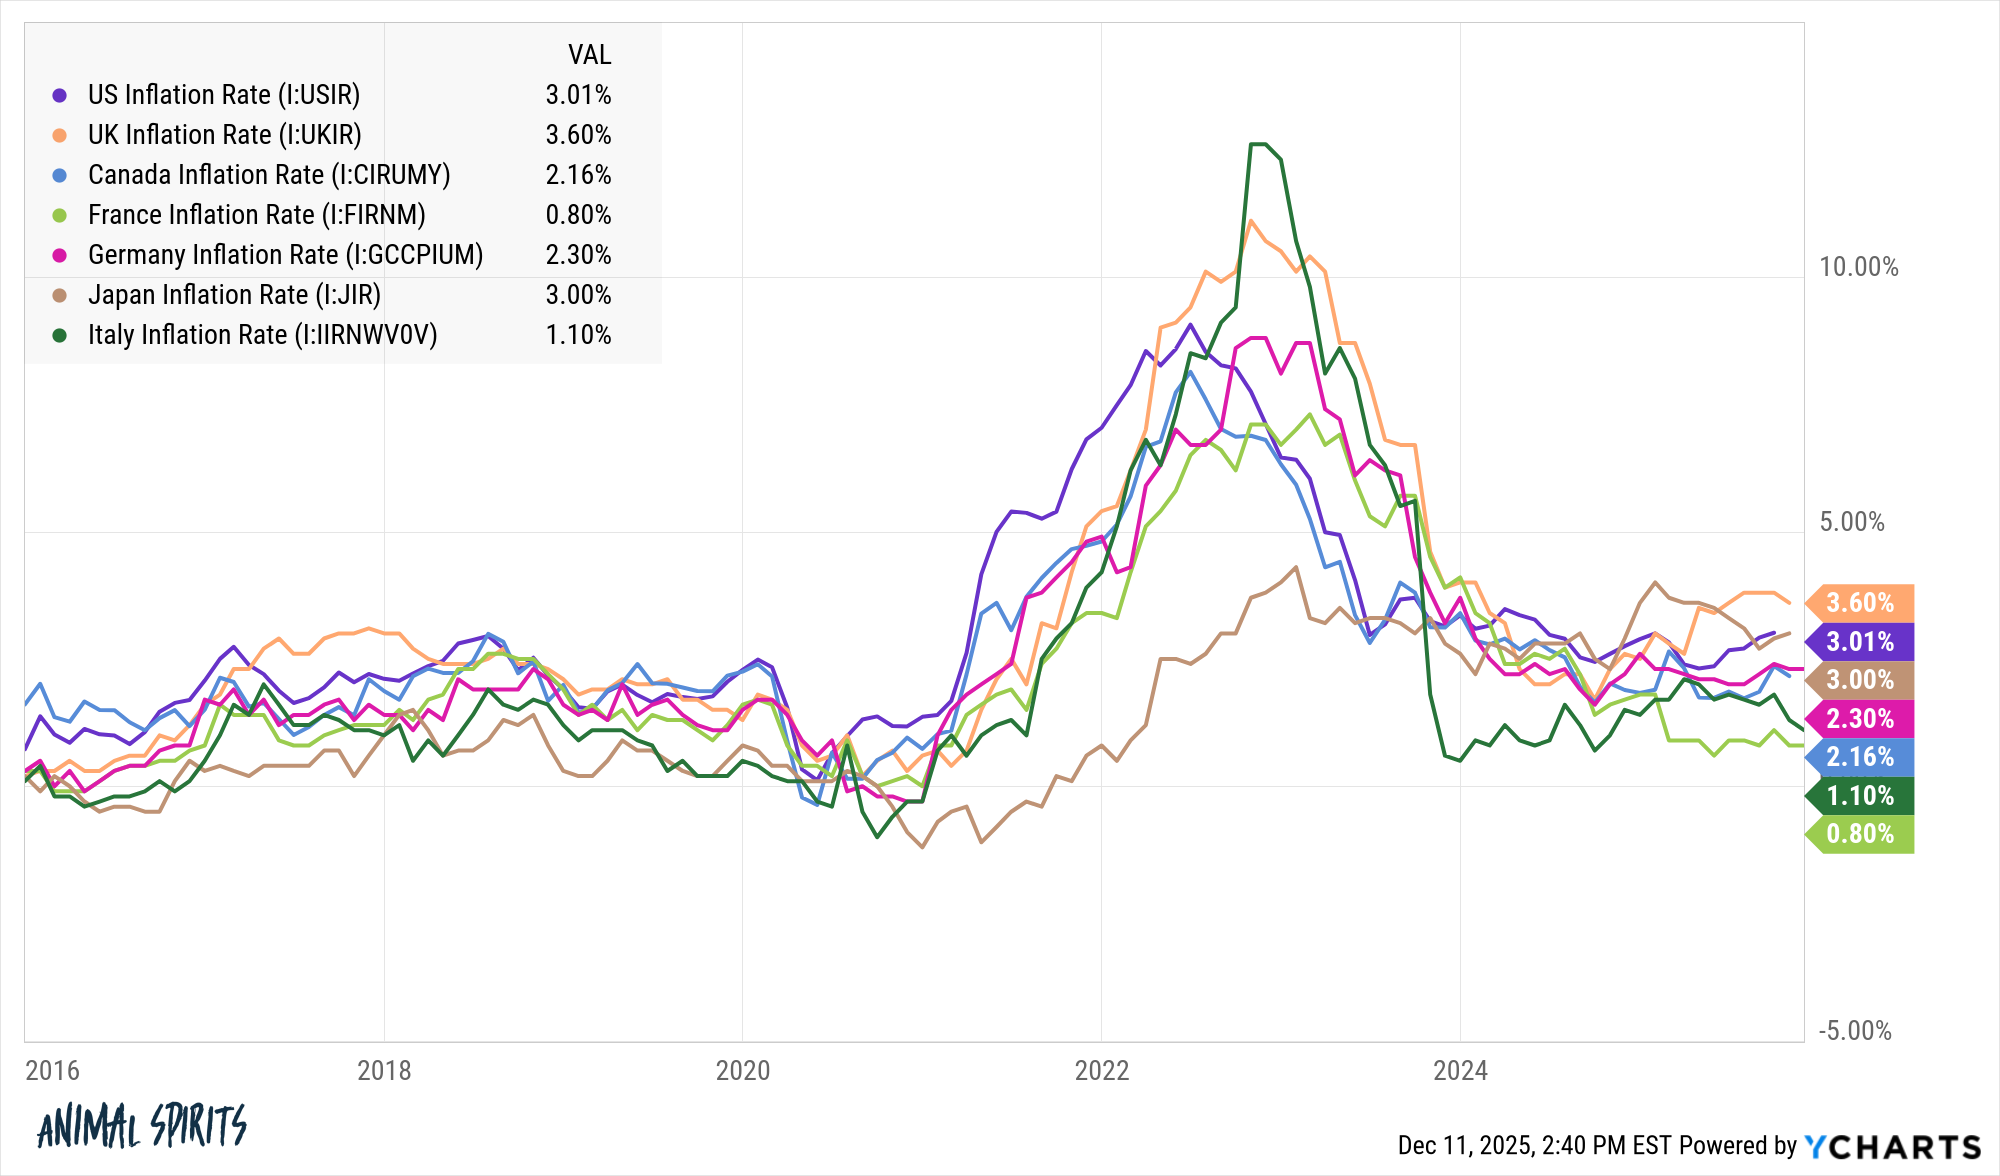
Fed officials tried to get inflation higher in the 2010s but couldn’t. Then a pandemic hits and inflation soars across the globe:
I do think consumers should get used to higher levels of cumulative inflation, though.
It certainly feels like nothing can stop the government-spending train, regardless of which party is in charge.
The difference between 2% and 3% inflation doesn’t seem like all that much, and it’s not over the short-term. But over a decade 2% annual inflation is 22% cumulative inflation while 3% annual inflation is 34% cumulative inflation.
Maybe AI will be deflationary.
Maybe we’ll get a recession that slows the pace of inflation or even causes deflation.
Maybe something will come out of left field yet again to change our economic trajectory.
Short of that, for the time being, it feels like 3% is the new 2% and there’s not much the Fed can do about it.
If you’re annoyed by the new prices of goods and services prepare to stay annoyed. We’re not going back to previous price levels.
Fidelity’s Jurrien Timmer joined us on Ask the Compound this week to answer questions about inflation, how much longer the bull market can last, the AI bubble, 60/40 portfolios, the bond market and more:
Further Reading:
The Relationship Between Wages and Inflation
This content, which contains security-related opinions and/or information, is provided for informational purposes only and should not be relied upon in any manner as professional advice, or an endorsement of any practices, products or services. There can be no guarantees or assurances that the views expressed here will be applicable for any particular facts or circumstances, and should not be relied upon in any manner. You should consult your own advisers as to legal, business, tax, and other related matters concerning any investment.
The commentary in this “post” (including any related blog, podcasts, videos, and social media) reflects the personal opinions, viewpoints, and analyses of the Ritholtz Wealth Management employees providing such comments, and should not be regarded the views of Ritholtz Wealth Management LLC. or its respective affiliates or as a description of advisory services provided by Ritholtz Wealth Management or performance returns of any Ritholtz Wealth Management Investments client.
References to any securities or digital assets, or performance data, are for illustrative purposes only and do not constitute an investment recommendation or offer to provide investment advisory services. Charts and graphs provided within are for informational purposes solely and should not be relied upon when making any investment decision. Past performance is not indicative of future results. The content speaks only as of the date indicated. Any projections, estimates, forecasts, targets, prospects, and/or opinions expressed in these materials are subject to change without notice and may differ or be contrary to opinions expressed by others.
The Compound Media, Inc., an affiliate of Ritholtz Wealth Management, receives payment from various entities for advertisements in affiliated podcasts, blogs and emails. Inclusion of such advertisements does not constitute or imply endorsement, sponsorship or recommendation thereof, or any affiliation therewith, by the Content Creator or by Ritholtz Wealth Management or any of its employees. Investments in securities involve the risk of loss. For additional advertisement disclaimers see here: https://www.ritholtzwealth.com/advertising-disclaimers
Please see disclosures here.