

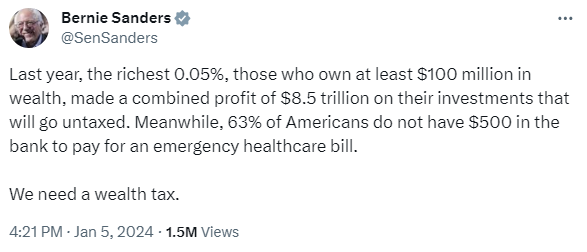
Bernie Sanders was railing against wealth inequality again last week:
The rich do control most of the financial assets in this country. The top 10% owns close to 90% of the stock market in the U.S. Most of the income gains in the past 40 years or so have gone to the wealthy.
That’s not great.
But the idea that two-thirds of all Americans cannot cover an emergency expense simply doesn’t hold up to the facts.
I’m guessing Sanders was referring to the Fed’s Economic Well-Being of American Households survey, which states:
When faced with a hypothetical expense of $400, 63 percent of all adults in 2022 said they would have covered it exclusively using cash, savings, or a credit card paid off at the next statement.
First off, Sanders transposed the numbers. It’s actually 63% of people who can cover that kind of emergency expense. Still, that’s more than one-third of people who say they can’t.
But that number is also misleading. Of the 37% who say they don’t have the cash on hand, just 13% said they would not be able to cover that emergency expense in some way:
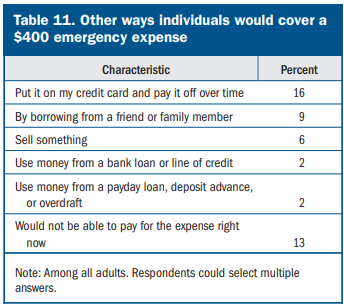
That’s still not great but it’s also not nearly as bad as the original datapoint.
So we’ve gone from 63% of people who couldn’t cover a $400 emergency expense to 13%.
Now look at these other results from that same survey:
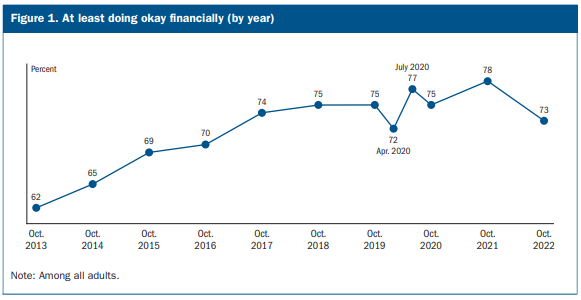
Roughly three-quarters of respondants are at least doing okay financially. And look at how many people have three months of expenses set aside for a rainy day fund:
In 2022, 54 percent of adults said they had set aside money for three months of expenses in an emergency savings or “rainy day” fund–down from a high of 59 percent of adults in 2021.
That’s far better than I would have expected.
Here are some statistics from the Federal Reserve that provide some more numbers on how American finances looked at the end of 2022:
Transaction accounts–which include checking accounts, savings accounts, money market accounts, call accounts, and prepaid debit cards–remained the most commonly held category of financial asset in 2022, with an ownership rate of 98.6 percent. The conditional median value of transaction accounts rose 30 percent between 2019 and 2022 to $8,000. The conditional mean value of transaction accounts in 2022 was $62,500, up 29 percent from 2019.
The real median net worth surged 37 percent to $192,900.
So the median amount of liquid cash on hand per household was $8,000 while the median net worth was nearly $193,000.
Since you all took statistics classes in high school, you understand this means half of all people had more than $8,000 in cash equivalents while half had less. Same thing with the net worth figures.
That’s much better than the picture Bernie Sanders was painting.
I’m not saying everything in this country is equal or fair. It’s not.
But things are much better than some people would have you believe.
Honestly, it’s true.
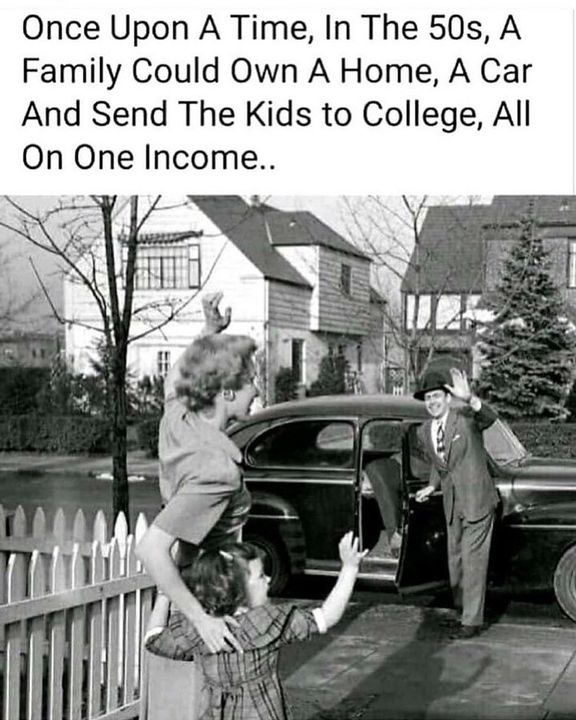
I’ve seen this meme floating around for a while now and it always irks me:
People have this idea that life was so much better and easier back in the 1950s as if everyone’s life was like Leave it to Beaver.
Yes things were cheaper back in the 1950s. College was cheaper. Housing was cheaper. But wages were also much lower. And much like the emergency expense number cited by Sanders, this meme is factually incorrect.
Here are the homeownership rates by decade going back to 1900 per the U.S. Census:
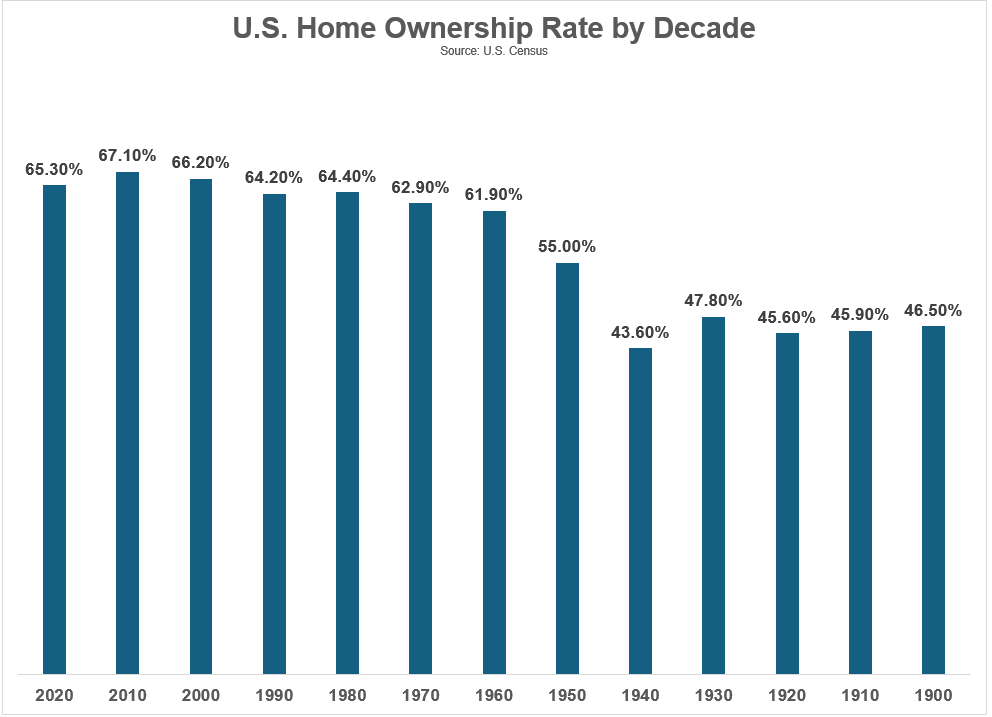
There was a huge spike from 1940 to 1960 from the GI bill and everyone moving to the suburbs to settle down after the war. But the homeownership rate is higher today than it was in the 1950s or 1960s.
Sure, you could buy a home in the 1950s for something like $8,000-$12,000. But the median household income was $3,300.
And you weren’t getting an HGTV-approved home in the 1950s. Those cheap homes everyone was buying were 700-900 square feet with two to three bedrooms and one bathroom. Most had no basement, porch or back deck. You were lucky if you got a one-stall garage.
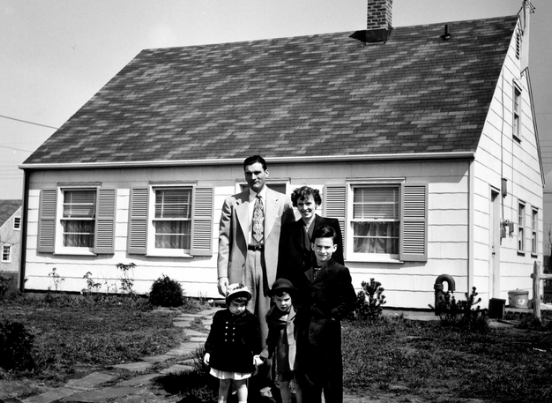
No open floor plans, granite countertops, stainless steel appliances, walk-in closets, man caves or room to entertain. Most homes were bare bones.
Plus, people had more kids back then, so they were smaller and more crowded than most households of today.
Car ownership wasn’t nearly as wide back then as it is today either.
By the end of the 1950s there was an average of 1.3 cars per household. Today the average is 2.1 vehicles per household (and those vehicles are much larger with better gas mileage). The number of households with two or more cars has increased from one in five by the end of the 1950s to nearly two-thirds today. Only 8% of households in America don’t own a car today.
It is true there are more dual-income households today. Just look at the labor force participation rate for women over the years:
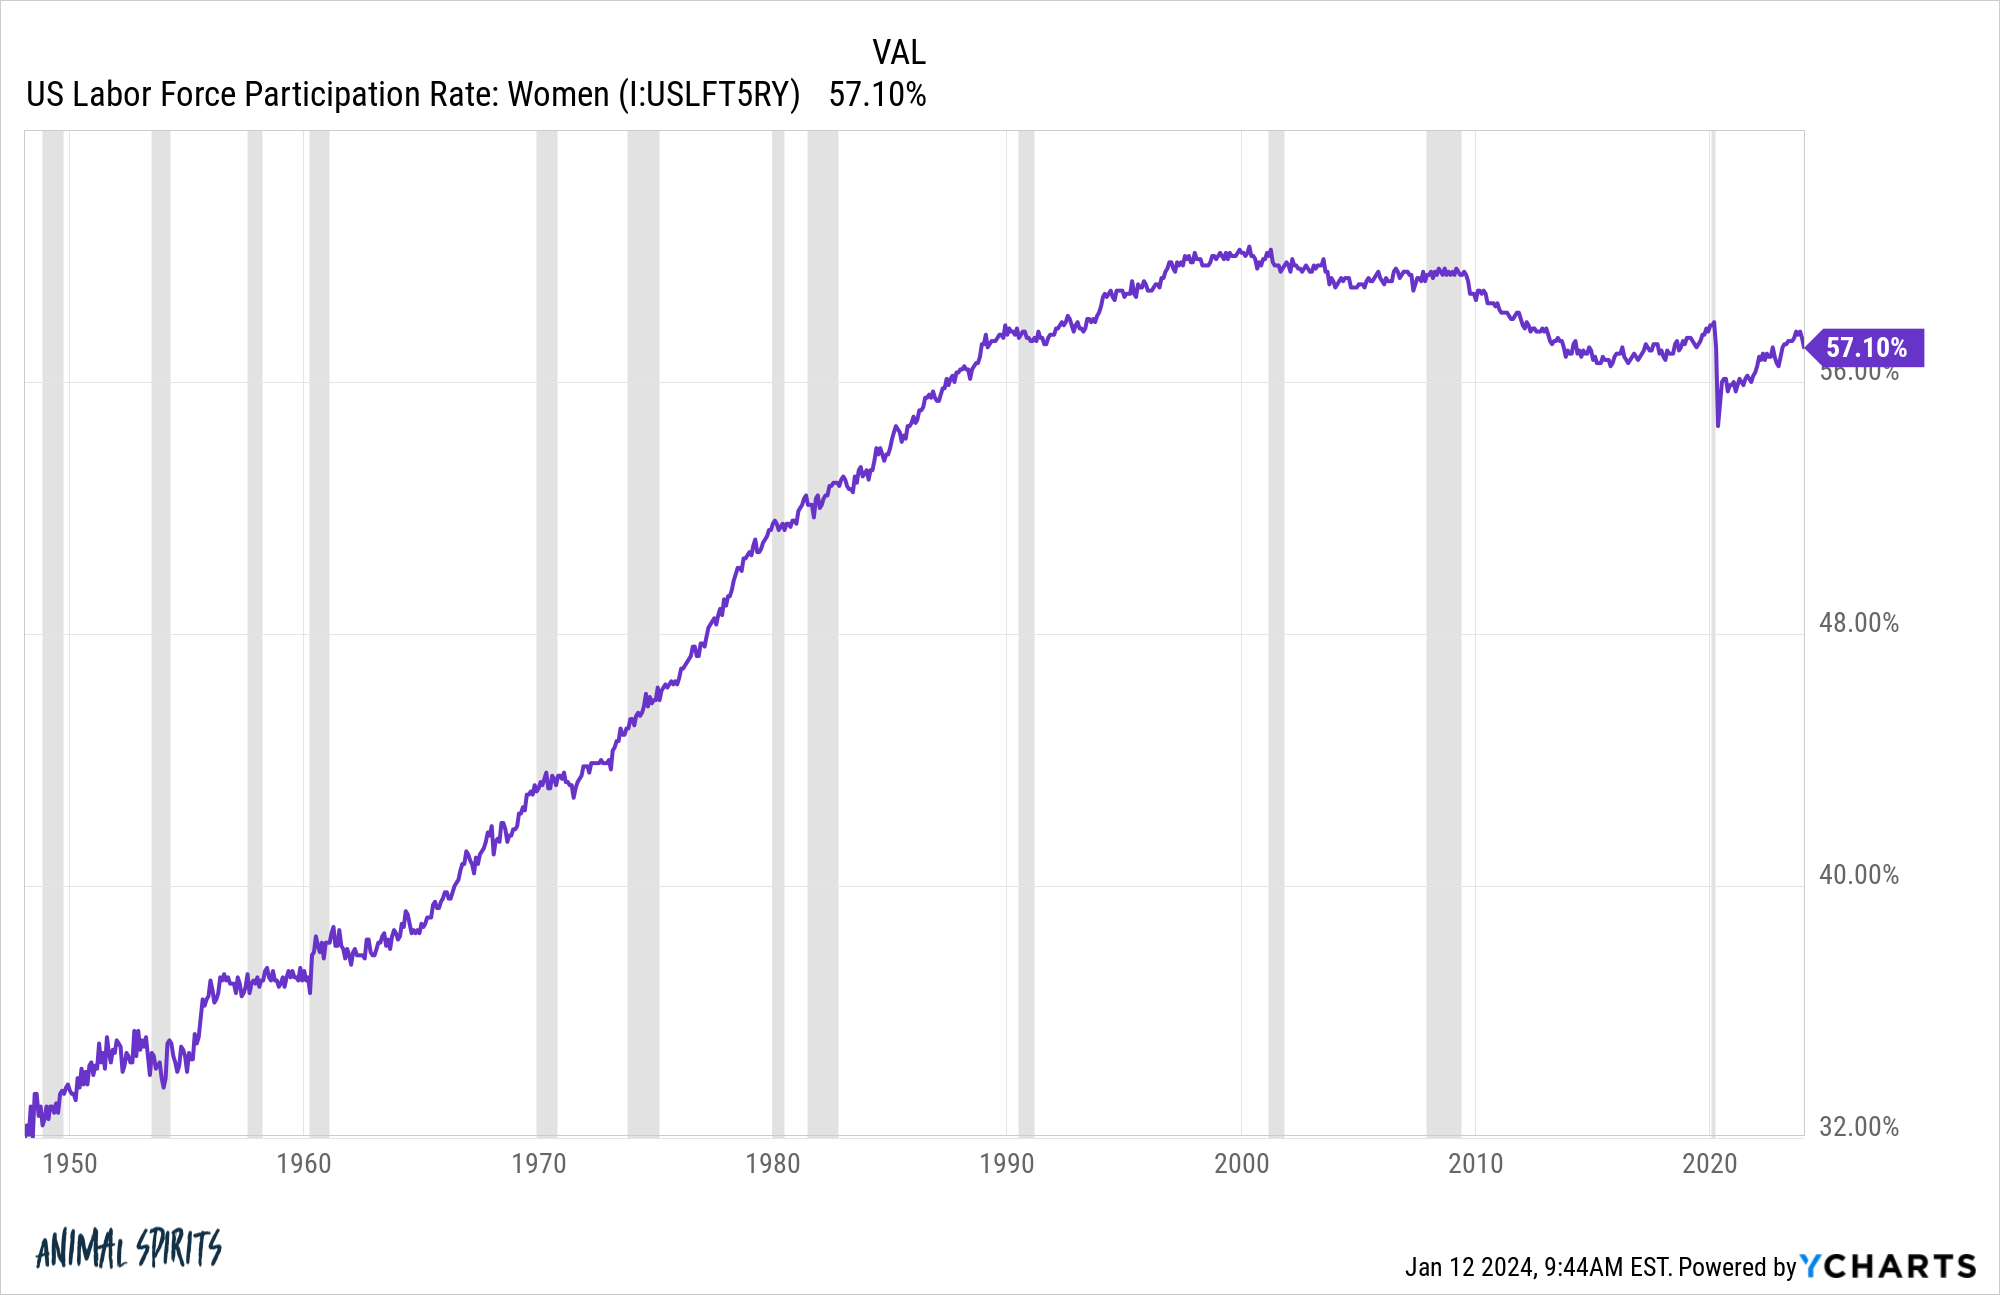
It’s basically doubled since the late-1940s.
Some would say the reason so many women entered the workforce is because everything is more expensive and people can’t make ends meet. That could be the case for some households.
But economic research shows the main reason so many women entered the workforce is because wages have increased so much and the labor market has changed:
The explosion of service-sector and white-collar jobs, such as being a clerk, meant that women could now earn a substantial wage in those industries. Additionally, while factory work was often seen as unsuitable for married women (either due to the physical labor involved or unsafe working conditions), no such stigma existed for office work. Slowly, women rejoined the labor market. The percentage of women between ages 25 and 54 with jobs or looking for work steadily crept up, from 42 percent in 1960 to 78 percent in August 2023–and not because women had to work to make ends meet. During this period, median female inflation-adjusted earnings doubled, from $26,560 in 1960 to $52,360 in 2022.
Better working conditions and higher wages are a pretty good incentive.
And most women with kids haven’t had to sacrifice family time to do it. It’s estimated single and working mothers today spend more time with their children than stay-at-home married mothers did in 1965.1
While college was much cheaper back in the 1950s, far fewer people attended. By 1957, there were 7.5 million college graduates in the United States. That’s around 7% of the 25 and older population back then.
Today nearly 40% of people 25 and older have a bachelor’s degree.
I’m not trying to say things are perfect in today’s economy. There are problems and there will always be problems.
But things aren’t as bad as many people make them out to be. We’ve seen real progress in this country over the decades, even though that progress hasn’t always been equal or fair.
So many people today have nostalgia for simpler times that never actually existed.
The good old days are right now.
Michael and I talked about the good old days and much more on this week’s Animal Spirits video:
Subscribe to The Compound so you never miss an episode:
Further Reading:
Golden Age Thinking
Now here’s what I’ve been reading lately:
Books:
1I suppose this is mainly because parents used to ignore their children more in the past. I’m only half kidding.
