


AI is the biggest story in the market this year, this decade and probably this century.
Predicting the boom-bust nature of how this cycle will play out is impossible. That won’t stop people from trying, of course.
The funny thing is you see people are making predictions years out into the future with certainty when the pros can’t even predict what will happen in the next 3, 6 or 12 months.
Stock market earnings are a case in point.
This chart shows how 2026 earnings estimates have changed since the start of the year: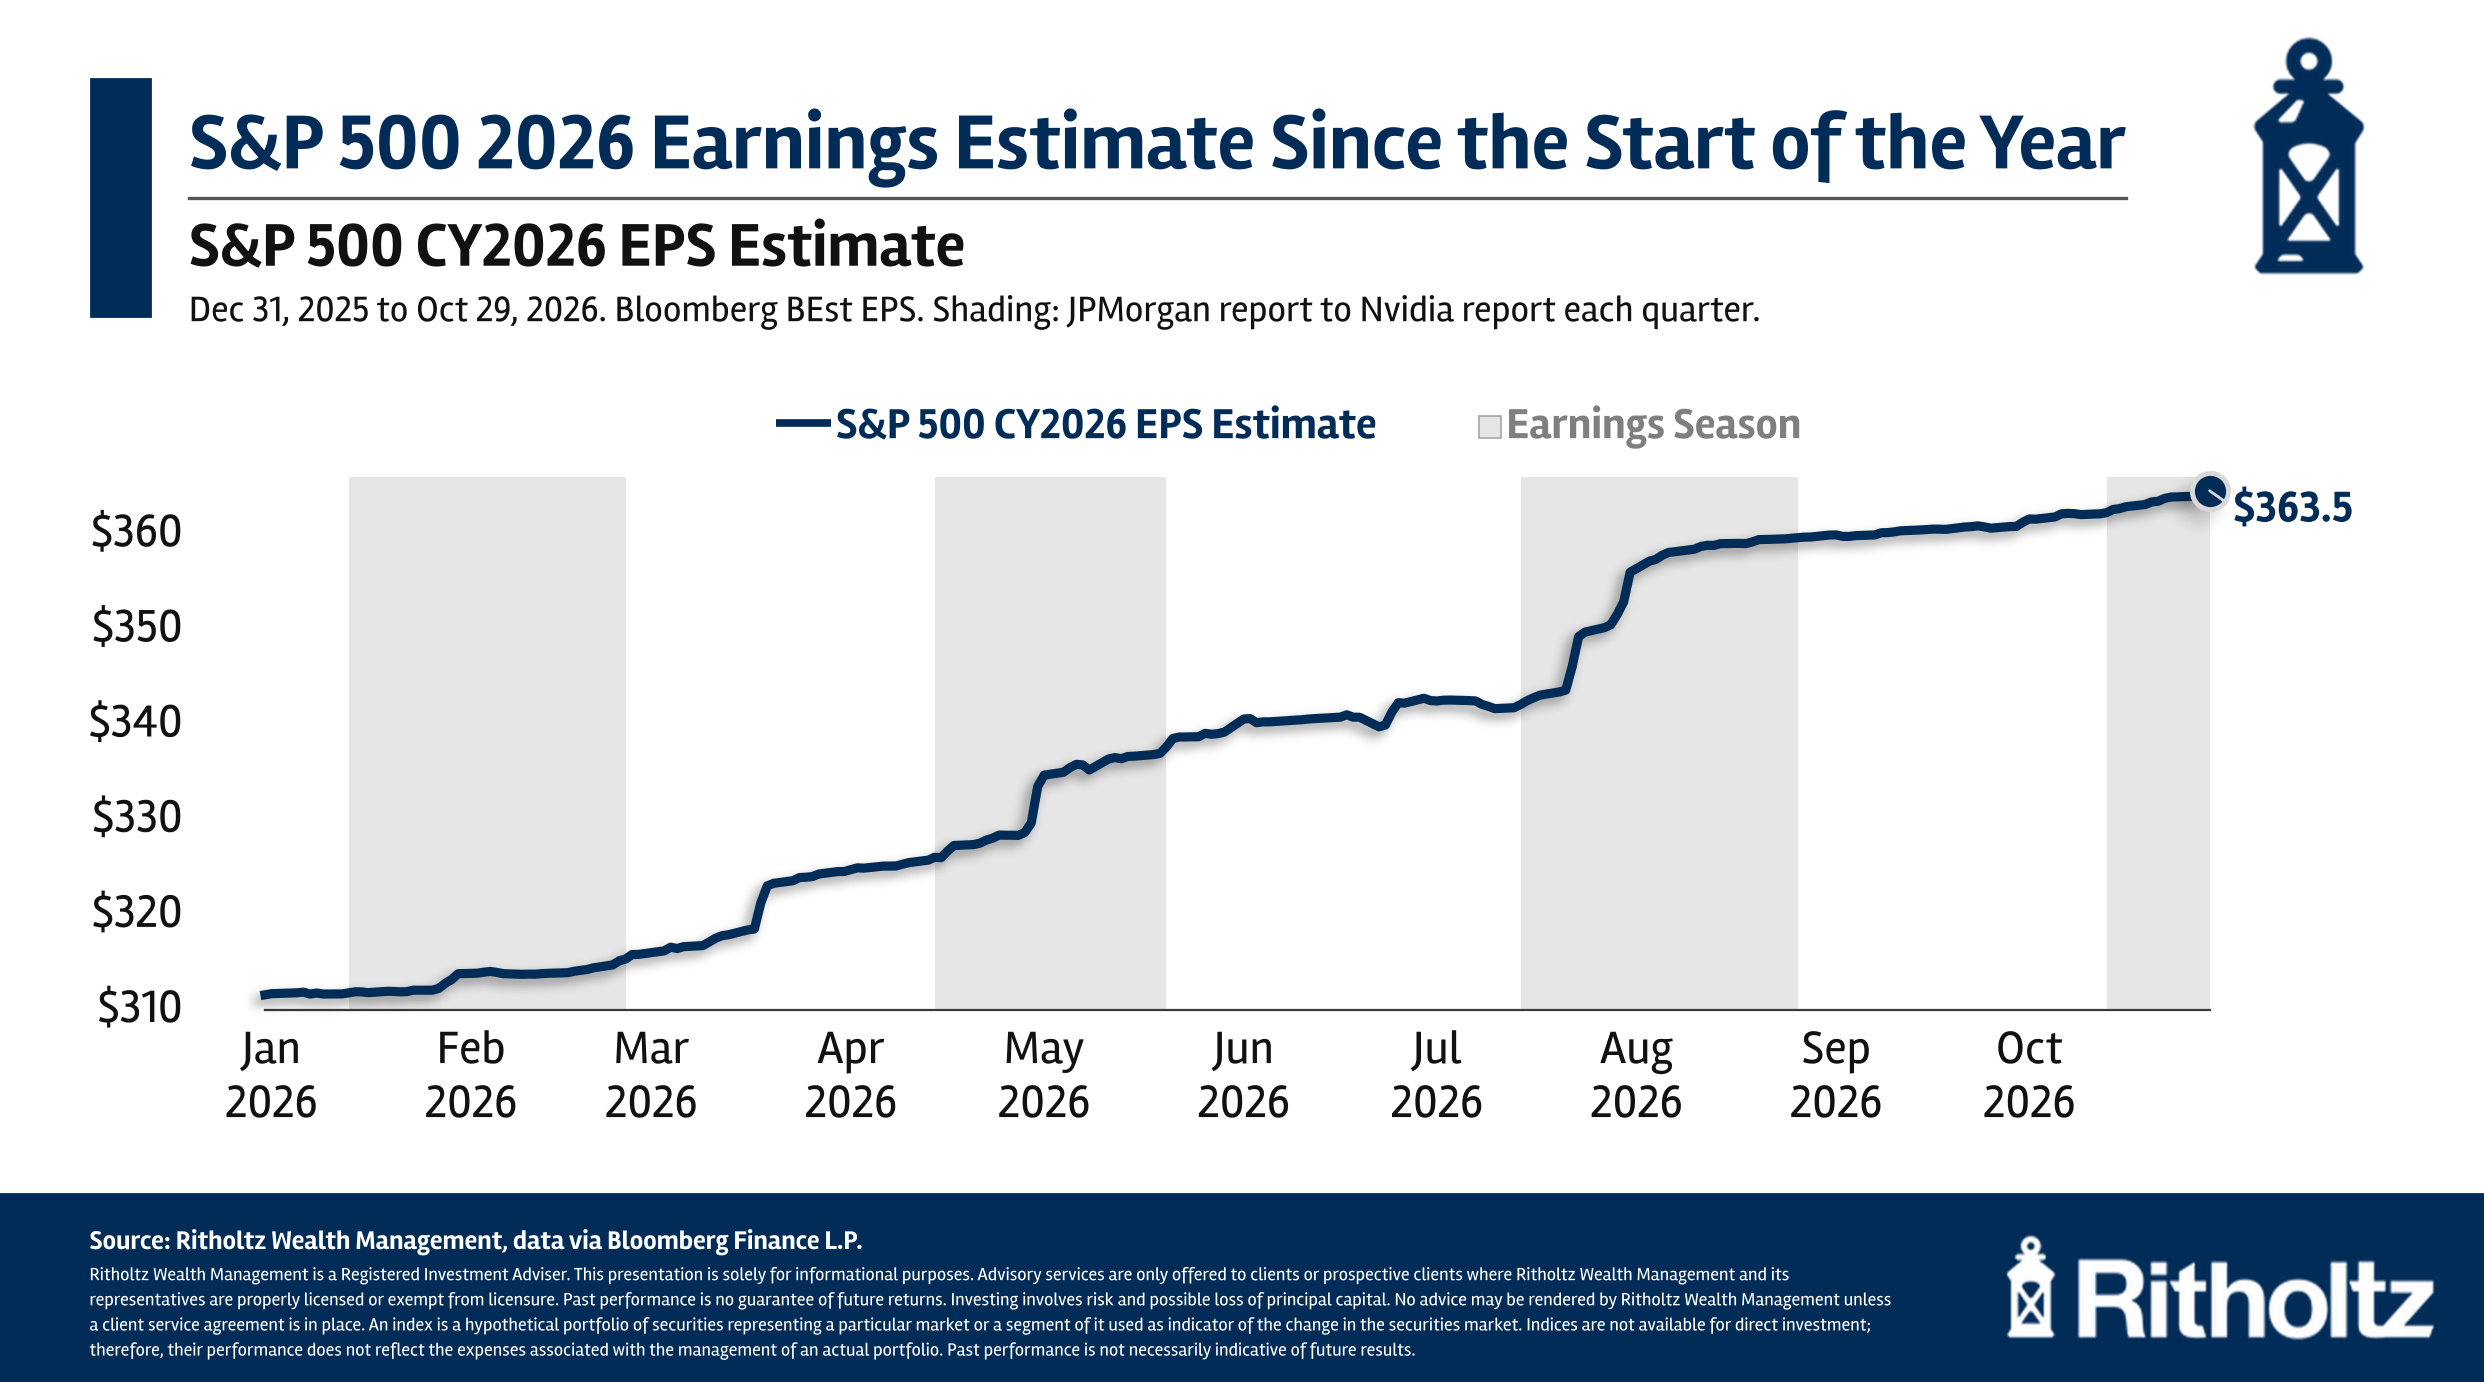
This isn’t earnings estimates 3, 5, 10 years into the future. This is just 2026 earnings!
Analysts estimated S&P 500 earnings of a little more than $310 when the year began. After a few earnings seasons came in much better than expected the year end estimate is now nearly 20% higher.
Not even close.
The S&P 500 is currently up around 12% on the year. Earnings have grown almost 30%. That means that valuations have fallen this year.
Here’s an interesting thought experiment based on these rapidly rising earnings numbers: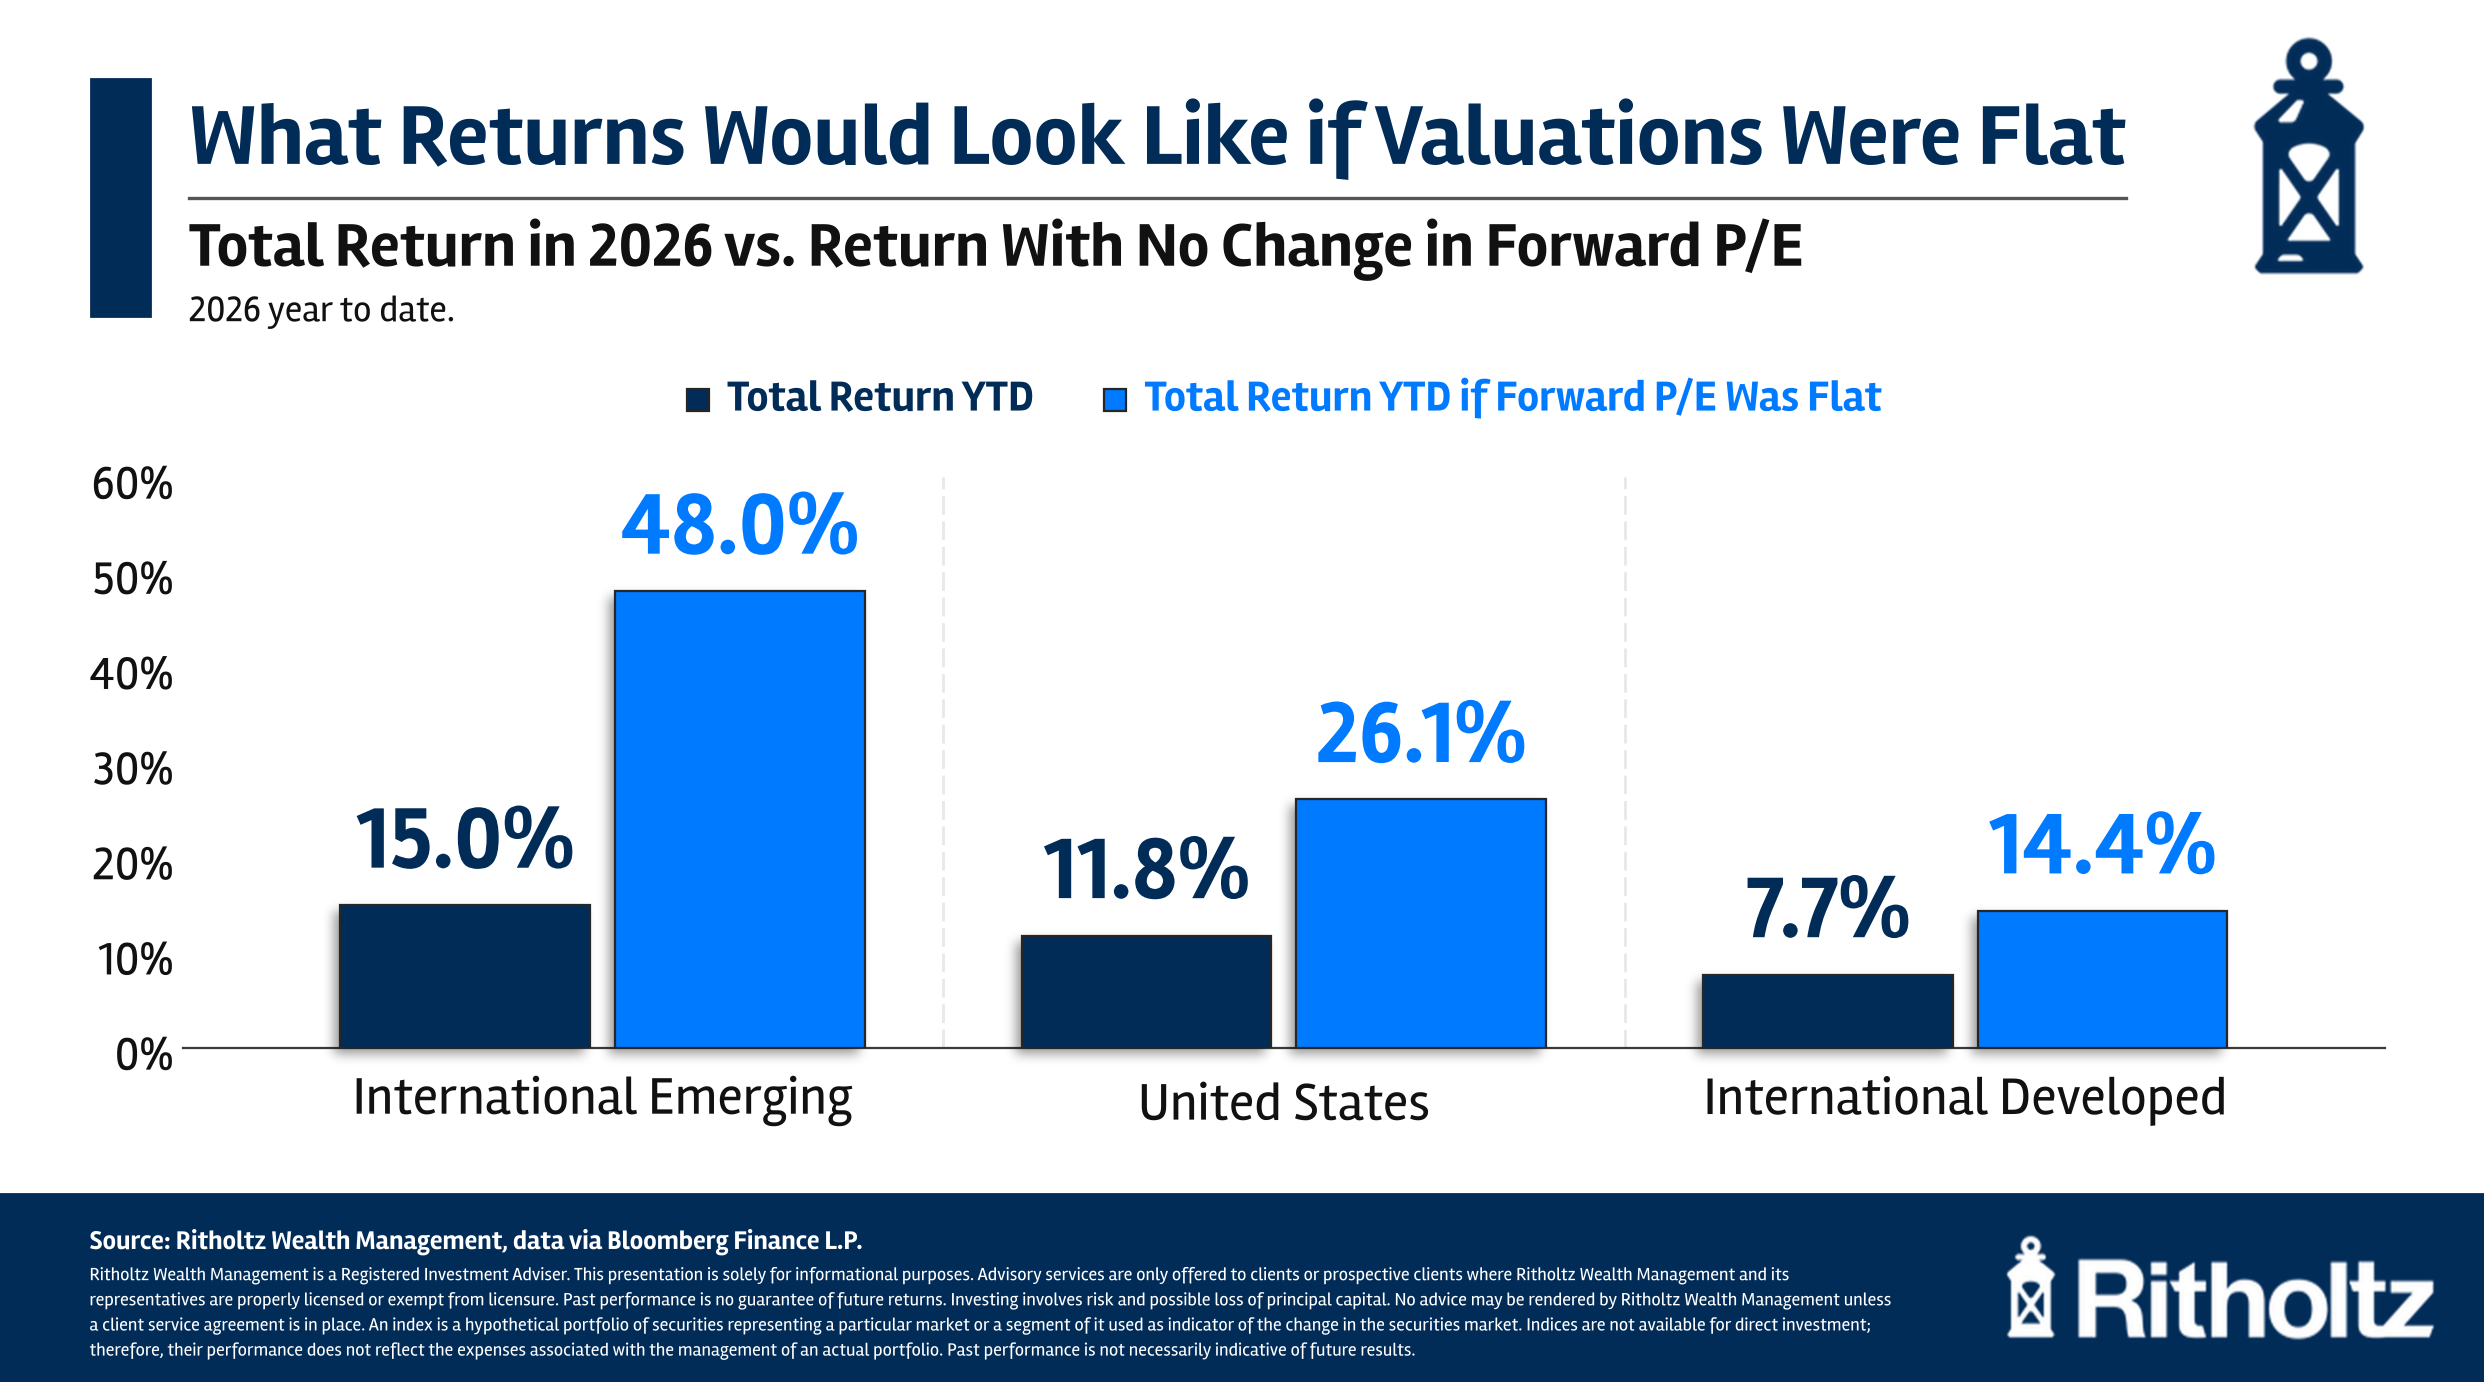
Many investors assume valuations go vertical during the market boom times. Instead they are falling. This chart shows what would have happened if forward P/E ratios had simply stayed the same. Stock market returns around the globe would have been much, much higher.
There are reasons this is happening.
Investors might be cautious that all this AI capex spending is inflating earnings and these numbers will come back down to earth. That could be possible.
It’s also true that it’s perfectly normal for there to be a massive disconnect between earnings and stock market returns.
Here’s a look at earnings growth and total returns on the S&P 500 by decade going back to the 1930s: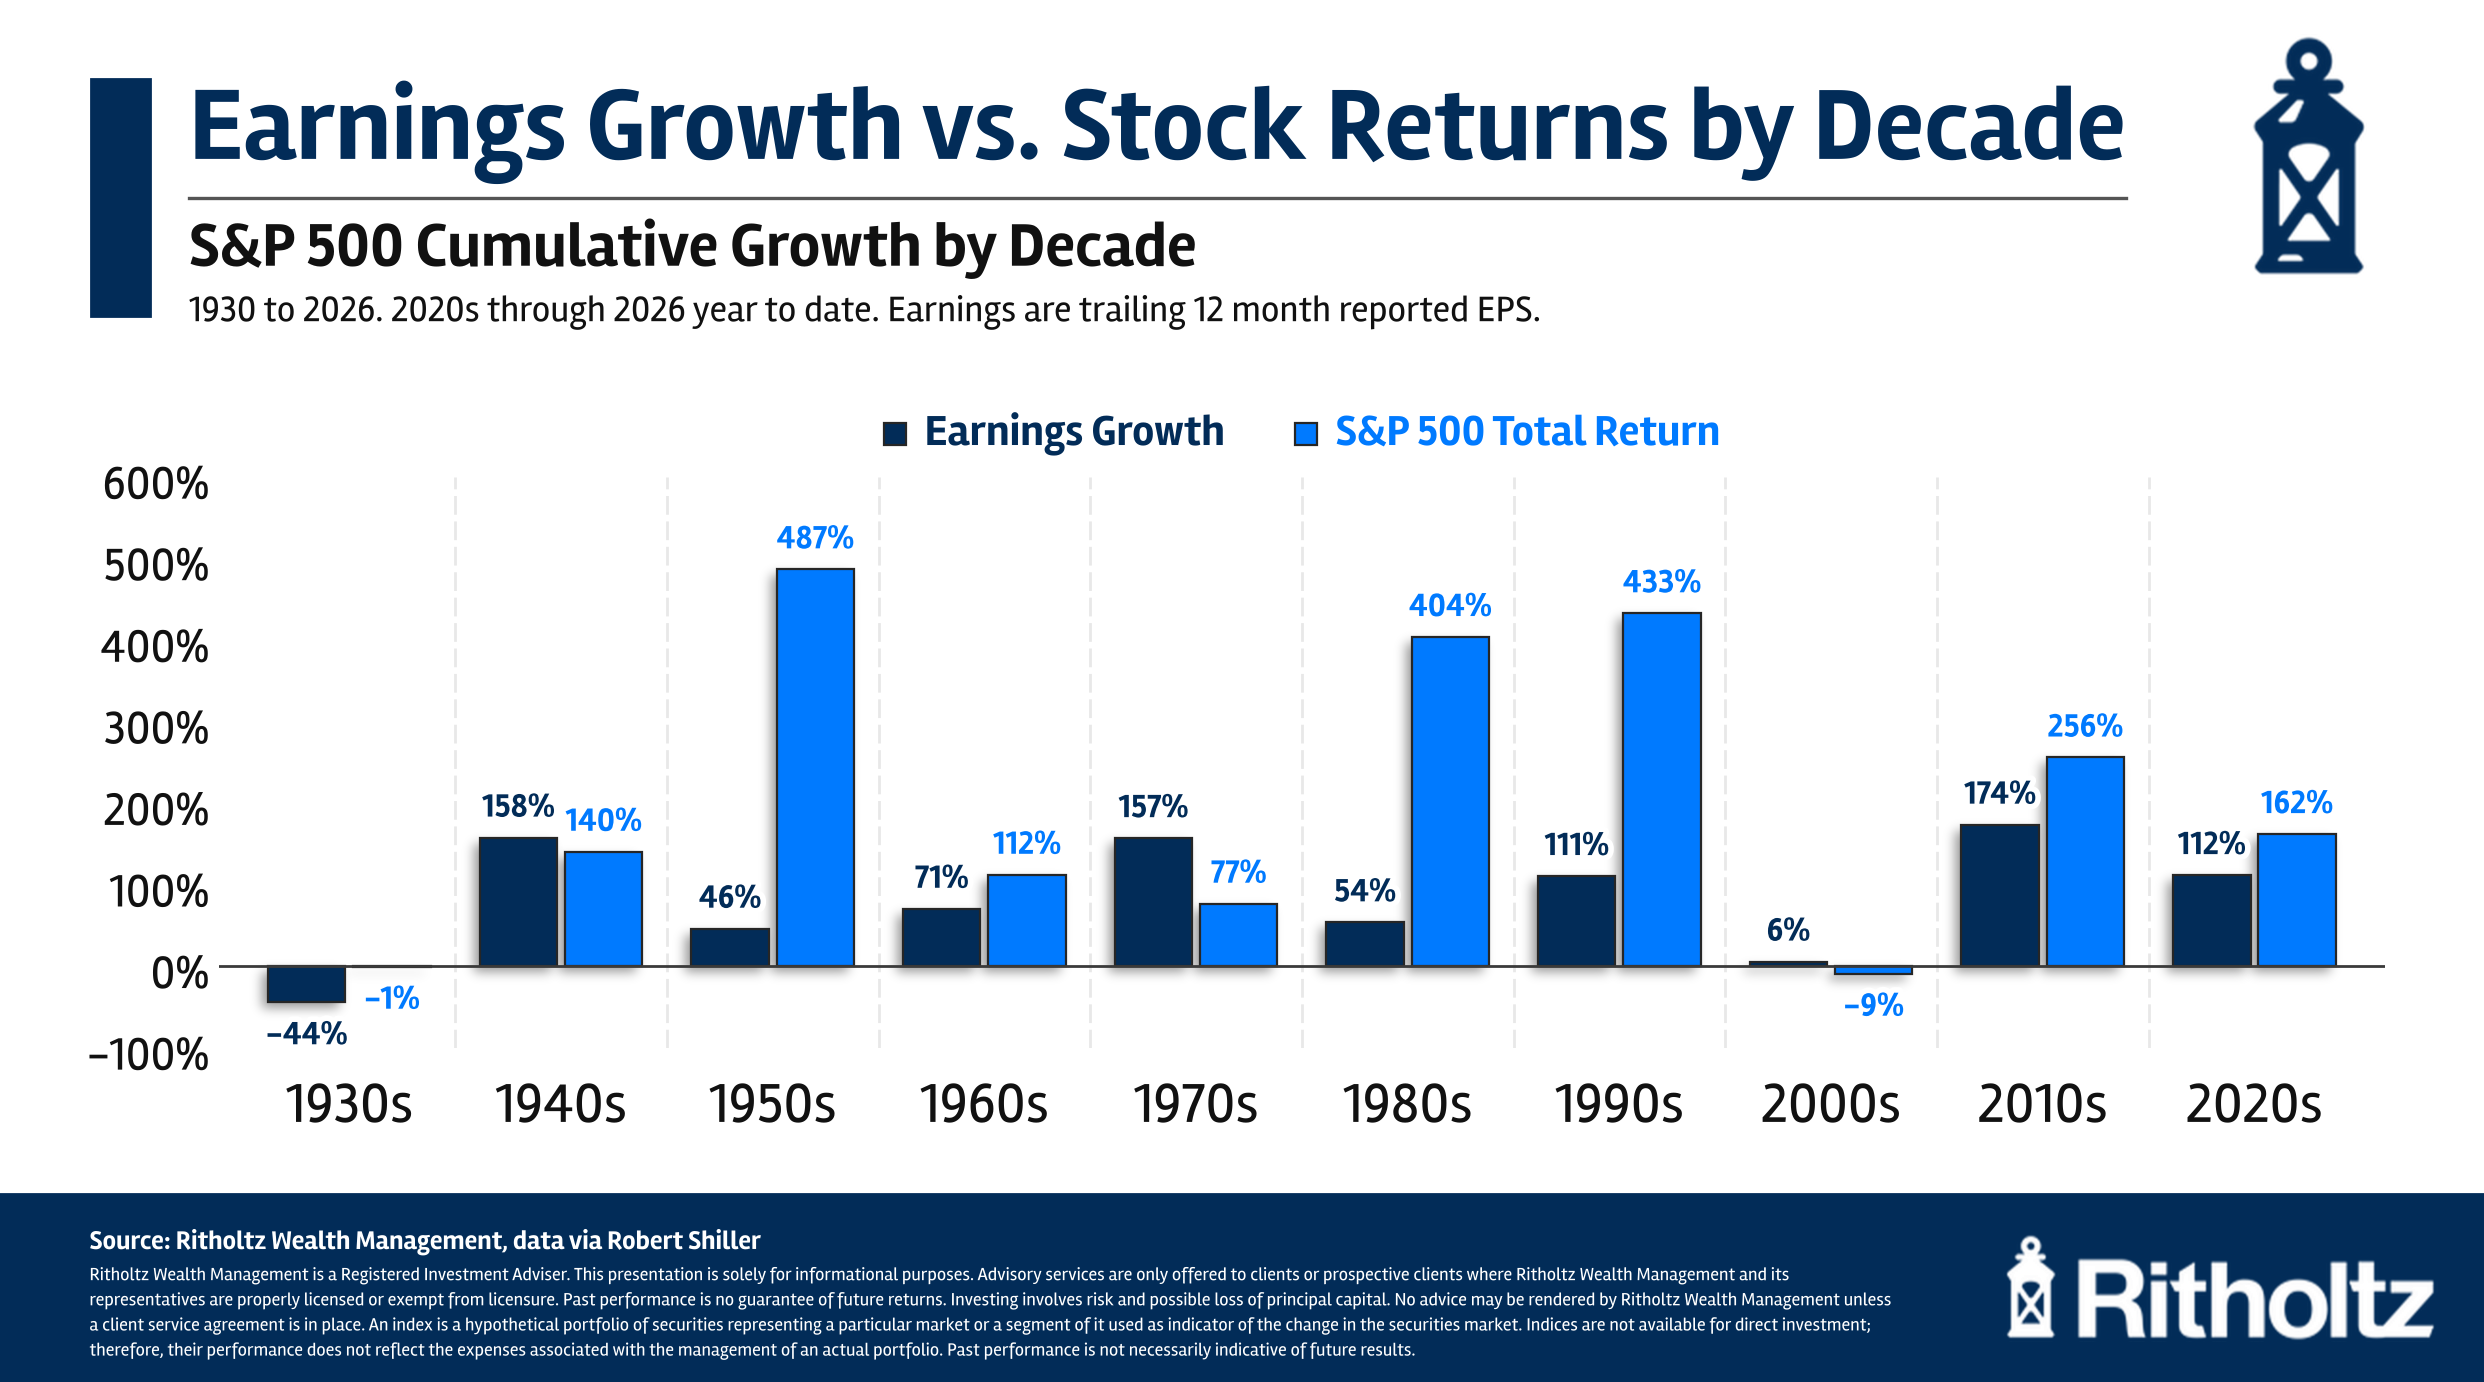
Sometimes there’s a relationship but it can often breakdown.
Earnings growth and stock prices were more or less in line with one another in the 1940s, 1960s, 2000s, 2010s and 2020s (thus far).
As bad as the stock market did in the 1930s, earnings were even worse. Earnings far outpaced the stock market in the 1970s. The stock market was up far more than profits in the 1950s. Same thing in the 1980s and 1990s in terms of growth.
These divergences can be even greater in any given year: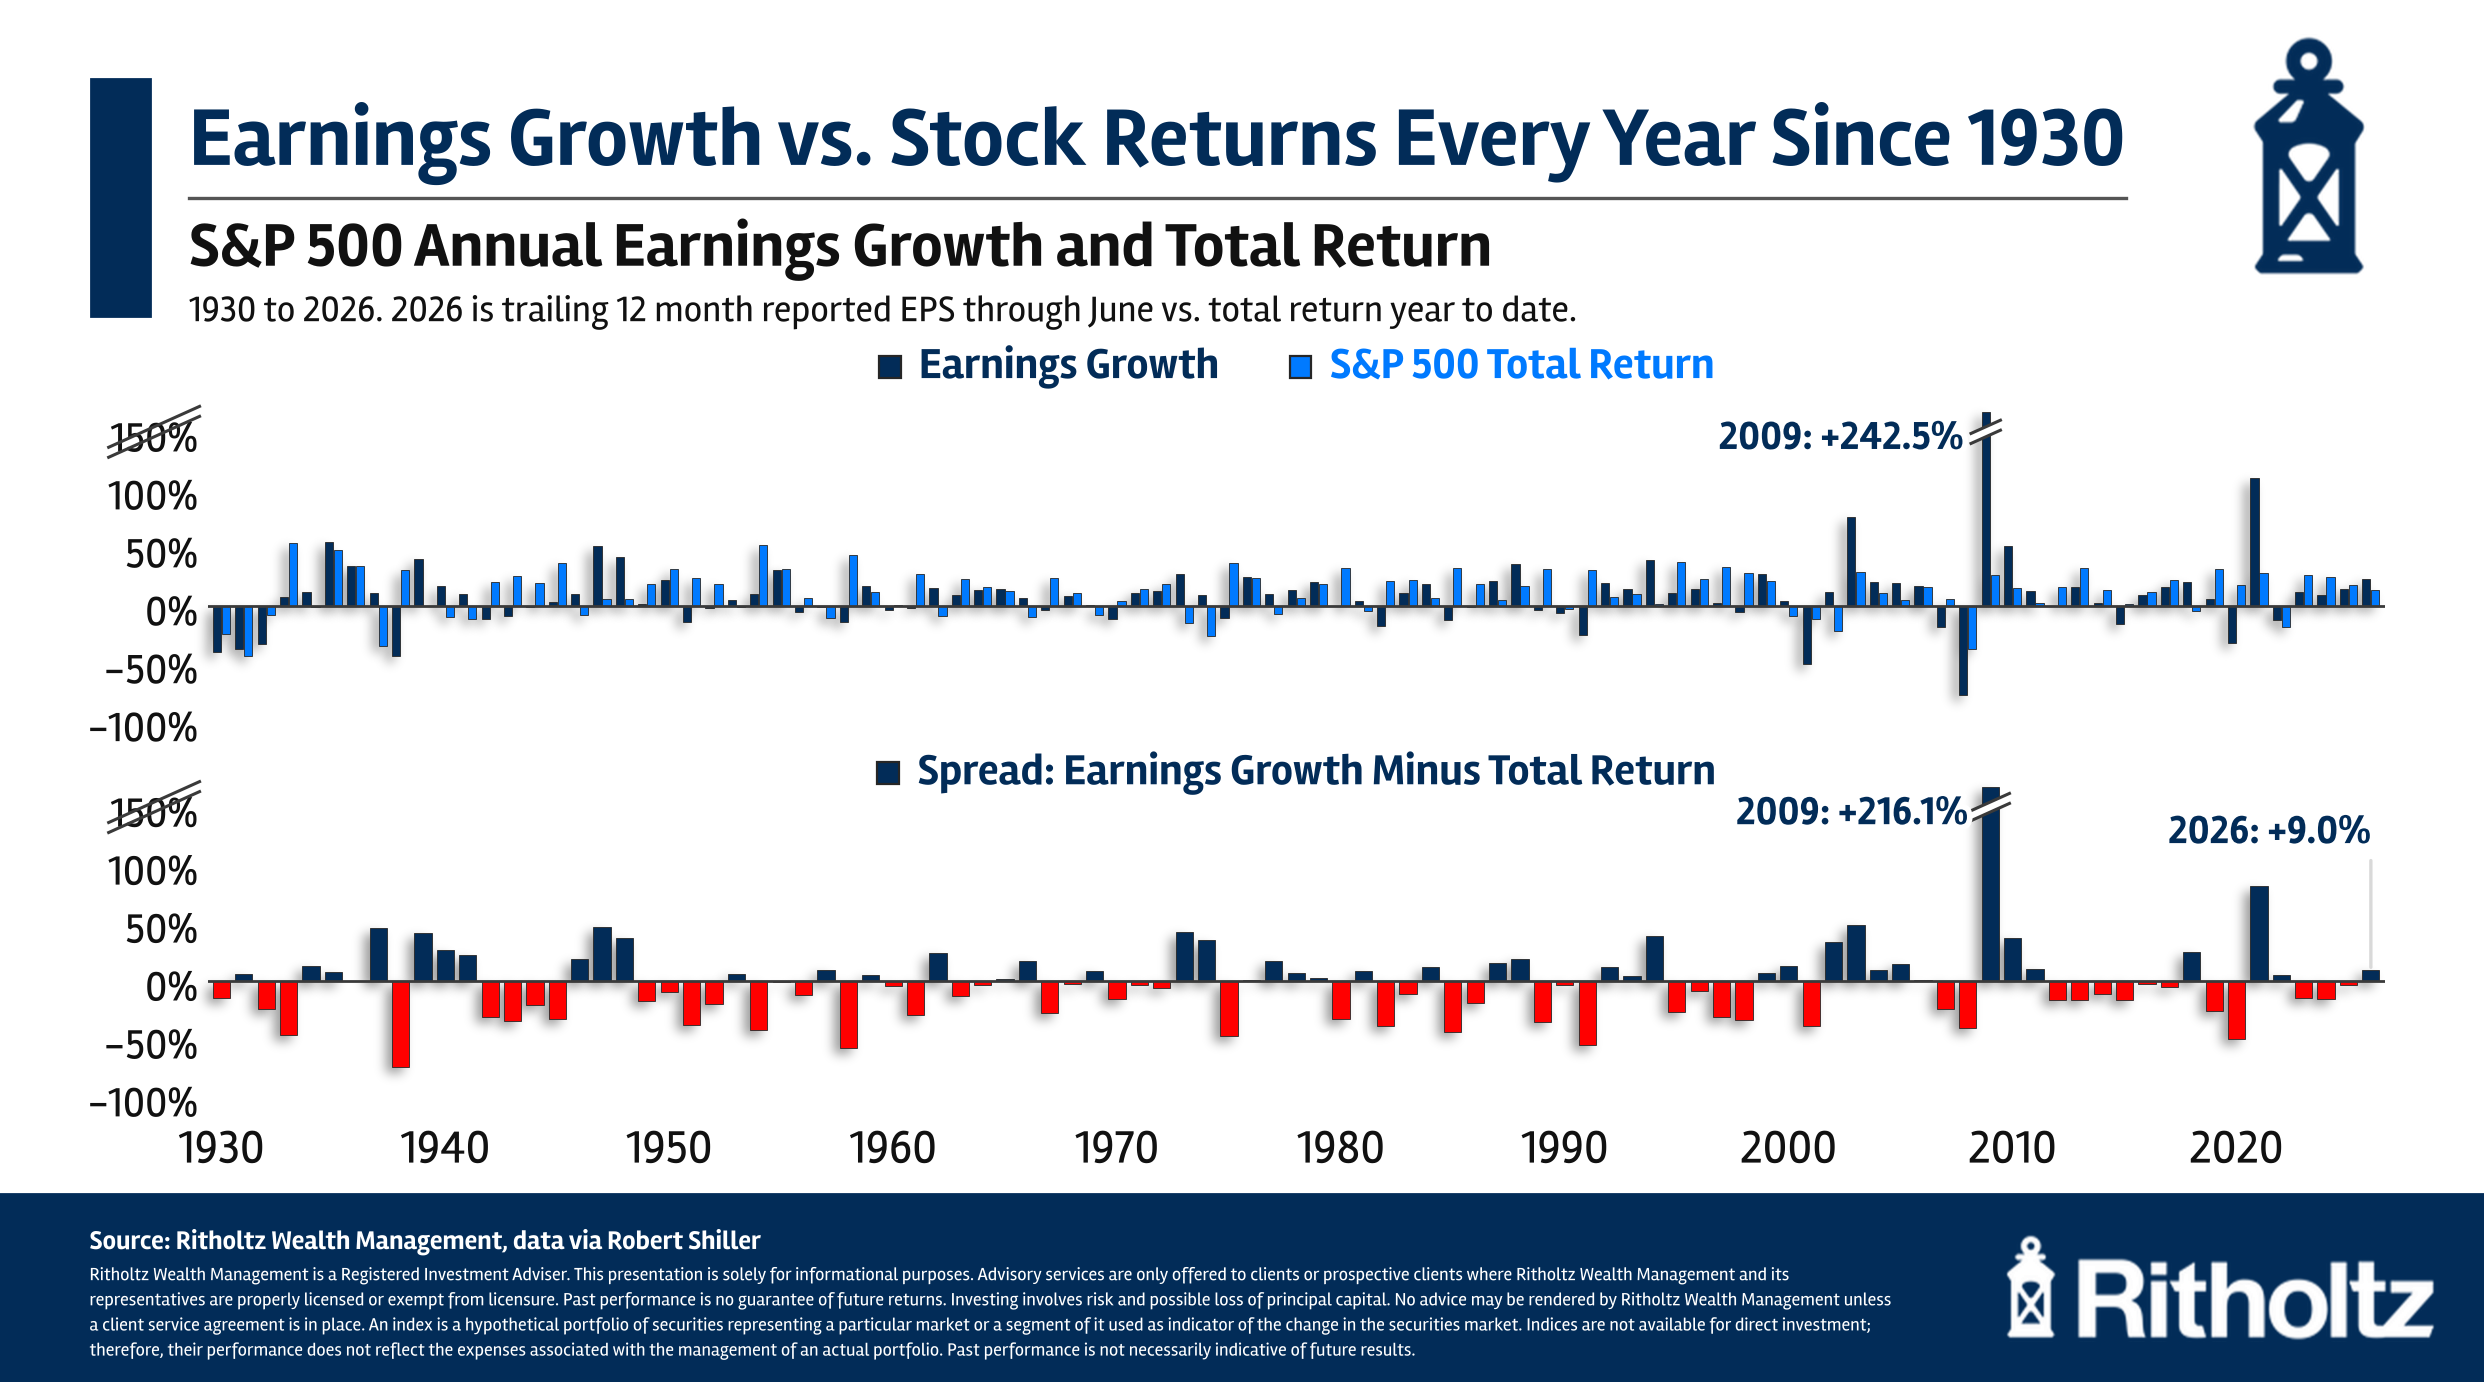
A wide spread between earnings growth and stock market returns looks to be the norm. The average absolute spread between the two numbers is almost 25%.1
This can be even more pronounced in individual securities and sectors.
For example, The Wall Street Journal broke down the individual components of the earnings growth this year by company:
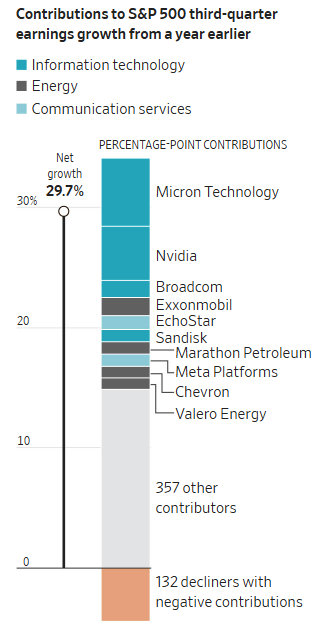
Ten companies are responsible for around two-thirds of the profit growth this year. Just two companies — Micron and Nvidia — make up one-third of the growth.
Yardeni Research made the point that the market doesn’t appear to trust the earnings of the semiconductors like Micron:
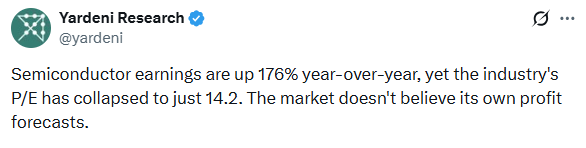
Profits for semiconductors are up nearly 200% while the stocks are up a little more than 40% on the year. And they are currently in a drawdown of more than 20% from the highs.
Fundamentals tell the story but you also have to take into account expectations and what’s priced into stocks. Most of the time no one knows what’s priced in.
In the long run fundamentals drive the stock market. In the short run the market and earnings are not always in lockstep with one another.
This is what makes investing int he stock market equal parts exciting and infuriating.
Michael and I talked about earnings, semiconductors and much more on this week’s Animal Spirits video:
Subscribe to The Compound so you never miss an episode.
Further Reading:
Is This a Bubble?
Now here’s what I’ve been reading lately:
Books:
1The median is 17%.
This content, which contains security-related opinions and/or information, is provided for informational purposes only and should not be relied upon in any manner as professional advice, or an endorsement of any practices, products or services. There can be no guarantees or assurances that the views expressed here will be applicable for any particular facts or circumstances, and should not be relied upon in any manner. You should consult your own advisers as to legal, business, tax, and other related matters concerning any investment.
The commentary in this “post” (including any related blog, podcasts, videos, and social media) reflects the personal opinions, viewpoints, and analyses of the Ritholtz Wealth Management employees providing such comments, and should not be regarded the views of Ritholtz Wealth Management LLC. or its respective affiliates or as a description of advisory services provided by Ritholtz Wealth Management or performance returns of any Ritholtz Wealth Management Investments client.
References to any securities or digital assets, or performance data, are for illustrative purposes only and do not constitute an investment recommendation or offer to provide investment advisory services. Charts and graphs provided within are for informational purposes solely and should not be relied upon when making any investment decision. Past performance is not indicative of future results. The content speaks only as of the date indicated. Any projections, estimates, forecasts, targets, prospects, and/or opinions expressed in these materials are subject to change without notice and may differ or be contrary to opinions expressed by others.
The Compound Media, Inc., an affiliate of Ritholtz Wealth Management, receives payment from various entities for advertisements in affiliated podcasts, blogs and emails. Inclusion of such advertisements does not constitute or imply endorsement, sponsorship or recommendation thereof, or any affiliation therewith, by the Content Creator or by Ritholtz Wealth Management or any of its employees. Investments in securities involve the risk of loss. For additional advertisement disclaimers see here: https://www.ritholtzwealth.com/advertising-disclaimers
Please see disclosures here.
